
Trimming for adaptors and low quality bases is important part of the analysis pipeline for sequencing data. Typically, after you isolate and fragment your RNA sample, adaptors are attached to the ends of the sequences that are needed for sequencing (see [1,2] for more background on sequencing). These adaptors need to be removed from the sequenced reads before downstream processing. An additional step that needs to be taken is removing low quality bases. Each base in the read is assigned a Q value, which is defined as the negative log of the probability the base was called incorrectly. Due to Illumina’s specific sequencing chemistry, the Q value tends to decrease (quality gets worse) towards the 3’ end of the read. These lower quality regions can negatively impact downstream analyses such as mapping, mutation calling, etc.
However, there has been some debate as to the utility of quality trimming for RNA-seq (see [3,4,5]). The summary of the research thus far is that trimming in RNA-seq generally leads to a decrease in the number of reads, but increases the proportion of mappable reads. However, the researchers suggest that aggressive trimming can negatively impact downstream analyses such as differential expression and expression estimation. It should also be noted that if you have a high quality RNA-seq dataset, quality trimming may not even be needed since it will make little impact. Quality trimming makes the most difference in lower-quality datasets.
Hence, to further demonstrate these points to our users, we show some example analyses on one RNA-seq sample.
Example data
We are using a single RNA-seq sample that has ~23 million, 151 bp paired end reads. The distribution of Q values by position in the read are shown in Figure 1. Since this is Illumina data, the Q values decrease towards the 3’ end. After mapping the reads with STAR, we get ~80% of the reads that are uniquely or multi-mapped (Figure 2).
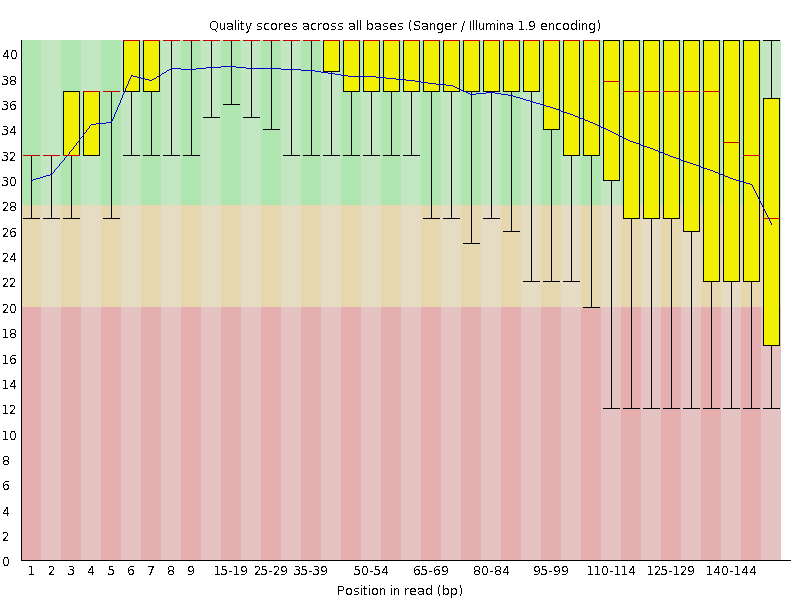
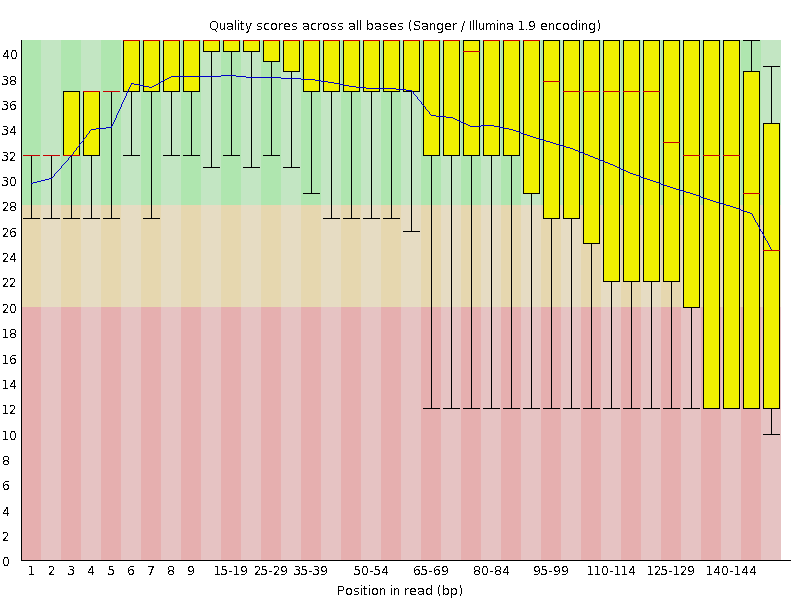
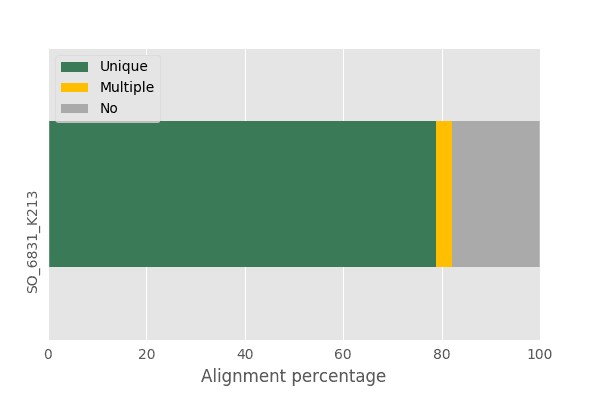
Figure 2: Percentage of reads uniquely mapped, multi-mapped, and un-mapped.
Next we trimmed the raw reads (using the fastp trimmer) using multiple different Q value thresholds (from 5,10, …, 30). Fastp works by looking at the average Q value in a window on the read and trims it if that average falls below the specified Q threshold. Figures 3 and 4 show percentages and counts, respectively, of uniquely mapped, multi-mapped, and un-mapped reads with increasing Q thresholds. The key findings from the results are that trimming does decrease the total number of reads, but it increases the proportion and total number of uniquely-mapped reads.
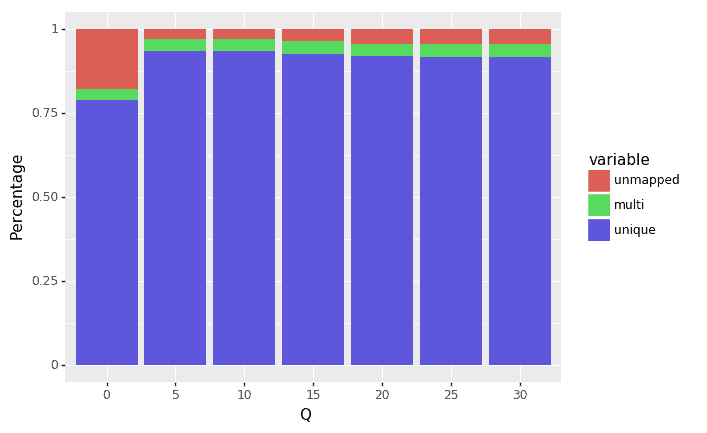
Figure 3: Relationship between Q threshold and percentage of reads that were uniquely mapped, multi-mapped, and unmapped.
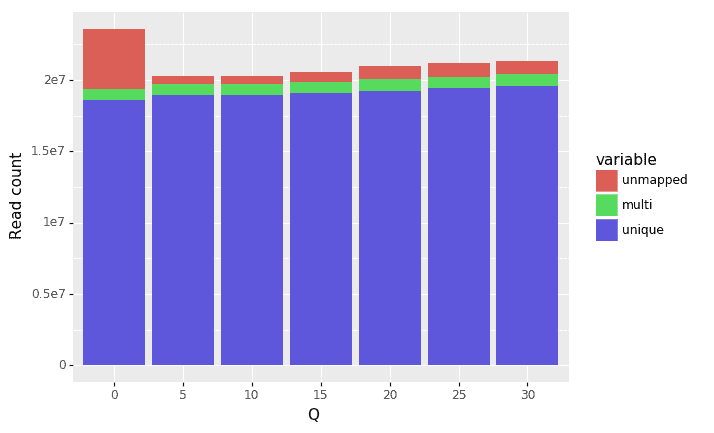
Figure 4: Relationship between Q threshold and number of reads that were uniquely mapped, multi-mapped, and unmapped. Note: the reason the total number of reads increases with Q values (after Q=5) is that fastp has by default an option to remove reads with more than 40% of bases below a separate quality threshold. So as more lower quality regions of the reads are removed with higher Q, less reads are removed as a whole.
Finally, to give our results some functional significance, we estimate the gene expression levels for each of the datasets. We computed the correlation in expression values between the un-trimmed data and each trimmed dataset (Figure 5). While we found that all correlations were very high, they started to drop off with more aggressive trimming (starting around a Q threshold of 20). Williams et al. found something similar, but went further and correlated the RNA-seq samples with microarray data from the same sample [3]. They too found aggressive trimming led to significant decreases in correlation.
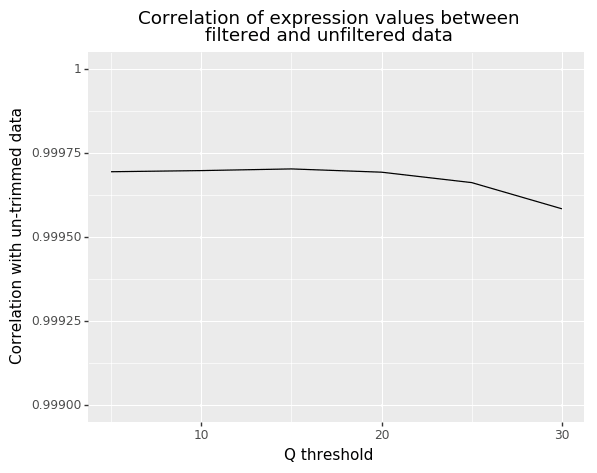
Figure 5: Correlation in gene expression between un-trimmed data and data after different Q threshold values.
Conclusions
Our findings with our one RNA-seq sample generally agree with previous research. That is:
• Quality trimming decreases the overall number of reads, but increases to the total and proportion of uniquely mapped reads. Thus, you get more useful data for downstream analyses.
• Too aggressive quality trimming can negatively impact downstream analysis (in our example, estimation of gene expression).
Hence, our own findings and that of the research community motivate the incorporation of a light amount of trimming in RNA-seq data (we use a Q threshold of 10).
References
1. Shendure, J., & Ji, H. (2008). Next-generation DNA sequencing. Nature Biotechnology, 26(10), 1135–1145. http://doi.org/10.1038/nbt1486
2. Ozsolak, F., & Milos, P. M. (2011). RNA sequencing: advances, challenges and opportunities. Nature Reviews Genetics, 12(2), 87–98. http://doi.org/10.1038/nrg2934
3. Williams, C. R., Baccarella, A., Parrish, J. Z., & Kim, C. C. (2016). Trimming of sequence reads alters RNA- Seq gene expression estimates. BMC Bioinformatics, 1–13. http://doi.org/10.1186/s12859-016-0956-2
4. MacManes, M. D. (2014). On the optimal trimming of high-throughput mRNA sequence data. Frontiers in Genetics, 5, 13. http://doi.org/10.3389/fgene.2014.00013
5. Del Fabbro, C., Scalabrin, S., Morgante, M., & Giorgi, F. M. (2013). An extensive evaluation of read trimming effects on Illumina NGS data analysis. PLoS ONE, 8(12), e85024. http://doi.org/10.1371/journal.pone.0085024