
Automated ChIP-Seq Peak Calling, Alignment, and Pathway Analysis
Get publication-ready results within hours - not days or weeks. Basepair’s automated ChIP-Seq data analysis enables alignment, read counts (complete with trimming and deduplication numbers), peak calling, pathway enrichment analysis, motif analysis, and interactive figures and plots to get you closer to publication. Analyze Six Samples For FreeWhat is ChIP sequencing?
ChIP-Seq refers to chromatin immunoprecipitation followed by next generation sequencing (NGS). This technique is used to find DNA-protein binding, such as transcription factor binding sites, histone modification, open chromatin regions, and more. The core idea behind each of these techniques is to cross-link and immunoprecipitate the epitope of interest and then sequence the pull down DNA. For a more detailed introduction to ChiP-Seq why not check out our Analysis Tutorial.
Take control of your ChIP-Seq data with Basepair
Blazing fast
Basepair is able to scale from a single sample to thousands with the help of parallel processing. No coding required.
Publication-ready
Choose from ready-to-use ChIP-Seq analysis pipelines, hit Run, and get publication-ready results in hours, not days or weeks.
Trusted results
Basepair is used by top universities and peer-reviewer publications – with dozens of published studies using our software.
What’s included in the ChIP-Seq report?
Our ChIP-Seq pipelines include popular options such as alignment, QC, read counts, pathway and motif analysis, and peak calling, including a table of peaks and heatmaps. Below, you’ll find an overview of figures and interactive plots immediately available in your ChIP-Seq analysis report.
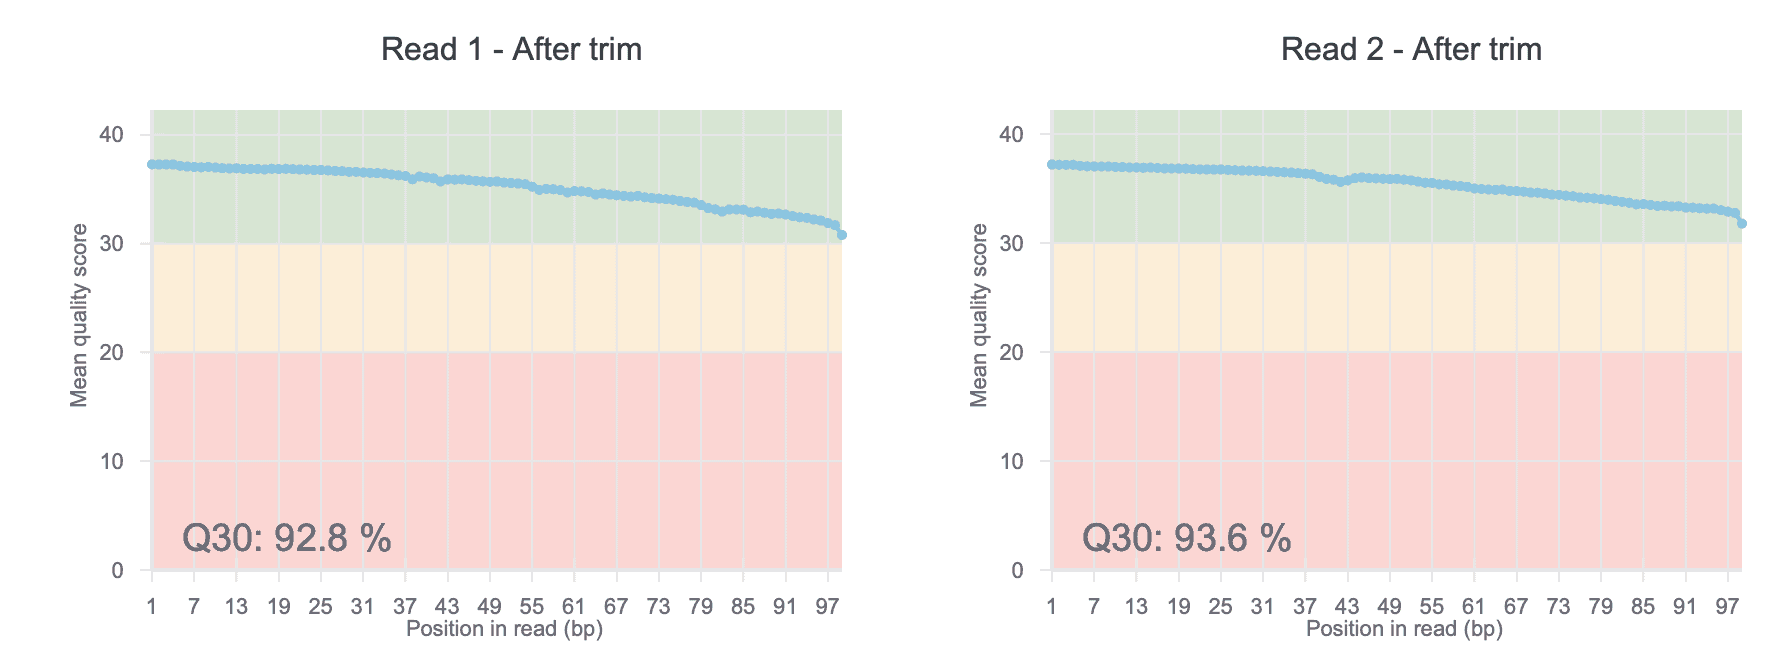
QC Plots
Check the quality of your raw ChIP-Seq data with our before- and after-trim QC charts. The QC score helps uncover any sequencing issues or contamination in your input data.
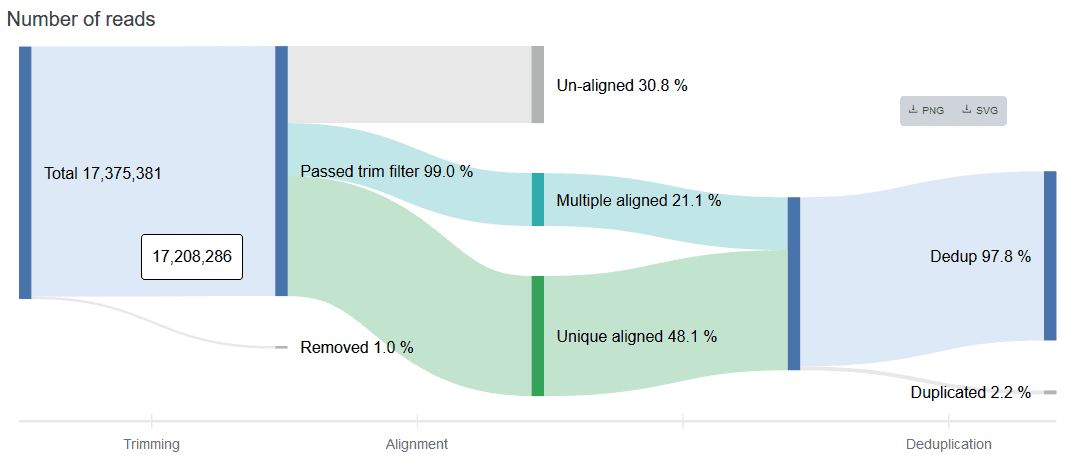
Read Count Flow
The read count flow helps provide a big-picture overview of usable reads at the end of the trimming, alignment, and deduplication processes. Think of the figure as a data analysis assembly line: input raw data, get an output of usable reads.
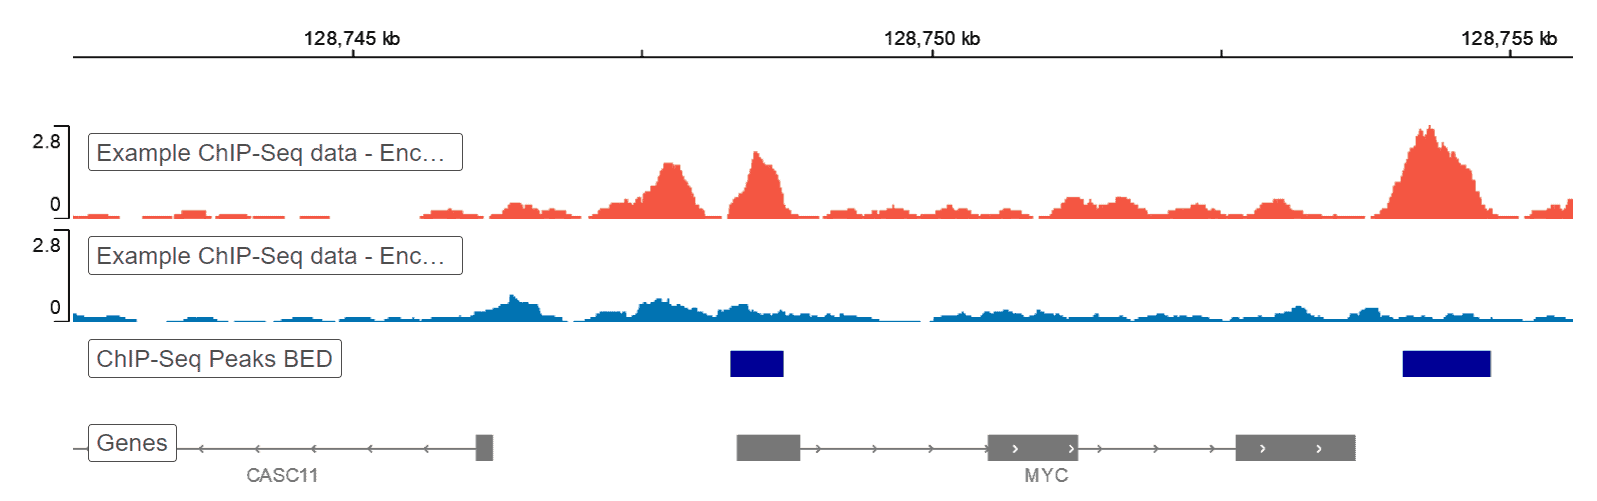
Genome Browser
Basepair’s built-in Genome Browser allows for a birds-eye view of you raw genomic data. Our platform handles any conversions under the hood, presenting you with a visual overview of your ChIP-Seq data without additional file conversions or software necessary.
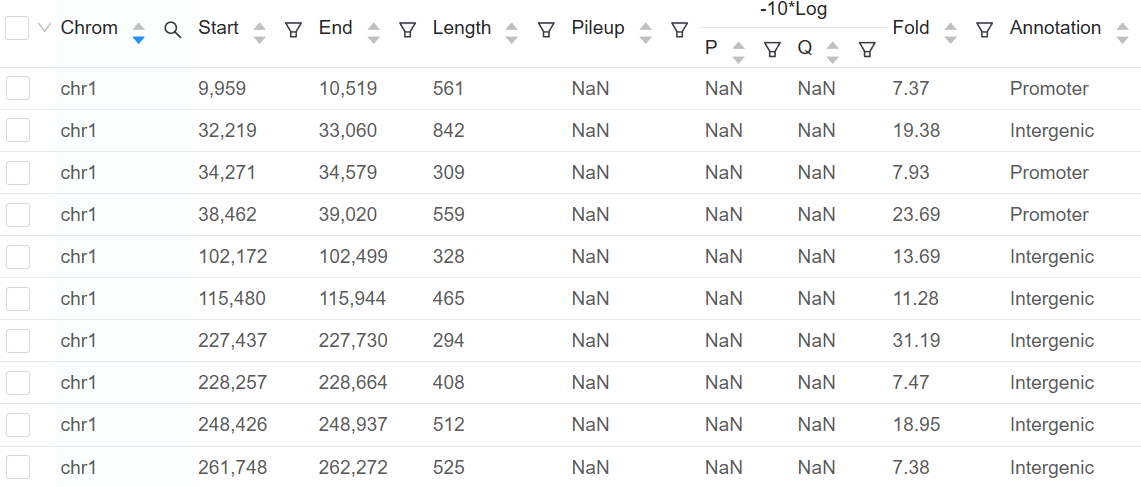
Peak Calling and Motif Analysis
Basepair can help you easily identify signal peaks in your data. Each peak is annotated as promoter, intronic, or intergenic, with the corresponing gene displayed. For any peaks found, we do a motif analysis to find overrepresented transcription factor binding sites.
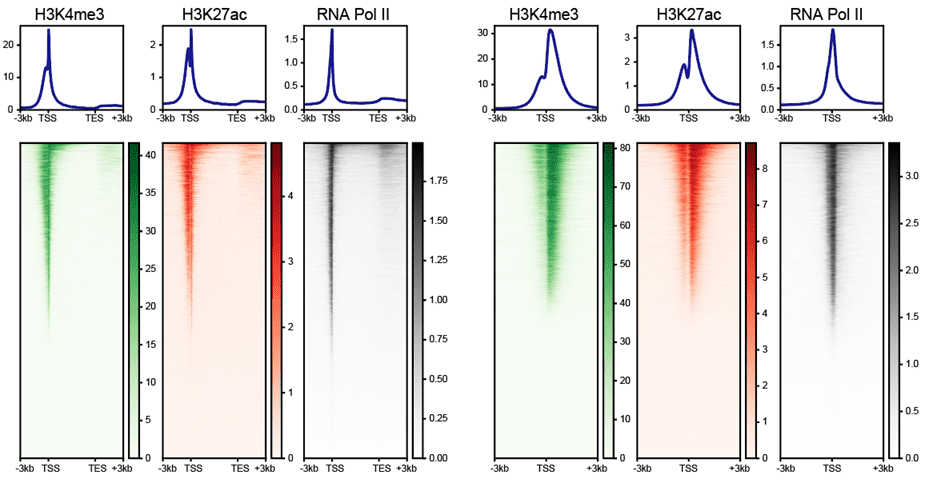
Heatmap & Profile for Gene Body and Transcription Start Site
The heatmap and composite profiles summarize your data around transcription start sites (TSSs) and annotated genes. This allows you to visually asses the overall quality of your ChIP-Seq data, including enrichment of your target over background and its binding pattern relative to genes.
Set up your ChIP-Seq analysis in minutes
Ready to try out our pipelines? We have a free 14 day trial! Explore our sample reports or upload your own ChIP-Seq data. Choose from a number of popular pipelines, such as QC, alignment, peak calling, motif analysis, and more. See why the world’s top institutions are using Basepair to save thousands of hours (and dollars) for their NGS data analysis needs.
Basepair Work is in Dozens of Peer-Reviewed Journals
"Fast, excellent and reasonably priced...you CAN get all three!! Thank you to the folks at Basepair for helping us deal with some difficult RNA Seq data."
"I really like how easy the website is to use. And how quickly the results are generated, including figures. I would have never thought about doing a new analysis like I just did."
"Support answers come fast and are always precise!"