
Analyzing single cell RNA-seq data? Our platform is fast and easy to use.
It’s 2024. There’s no reason to wait weeks for your bioinformatics core to analyze your sequencing data. Do it yourself today in just a few clicks with Basepair’s automated single cell RNA-seq pipelines.
Want to learn more about single cell RNA-seq analysis? View our latest single cell webinar recording.
Visualize and Interact With Your Single Cell Data
Basepair’s scRNA-seq pipeline is fast and built on the best peer-reviewed tools available. All steps of the pipeline — from alignment, expression quantification, to clustering and visualization — are entirely automated. Plus, we understand how crucial reporting and visuals are to single cell RNA-seq analysis and what a pain it can be to set up. That’s why we include a host of rich visual and interactive components as part of the interactive report that is generated every time you run the pipeline.
QUALITY CONTROL METRICS
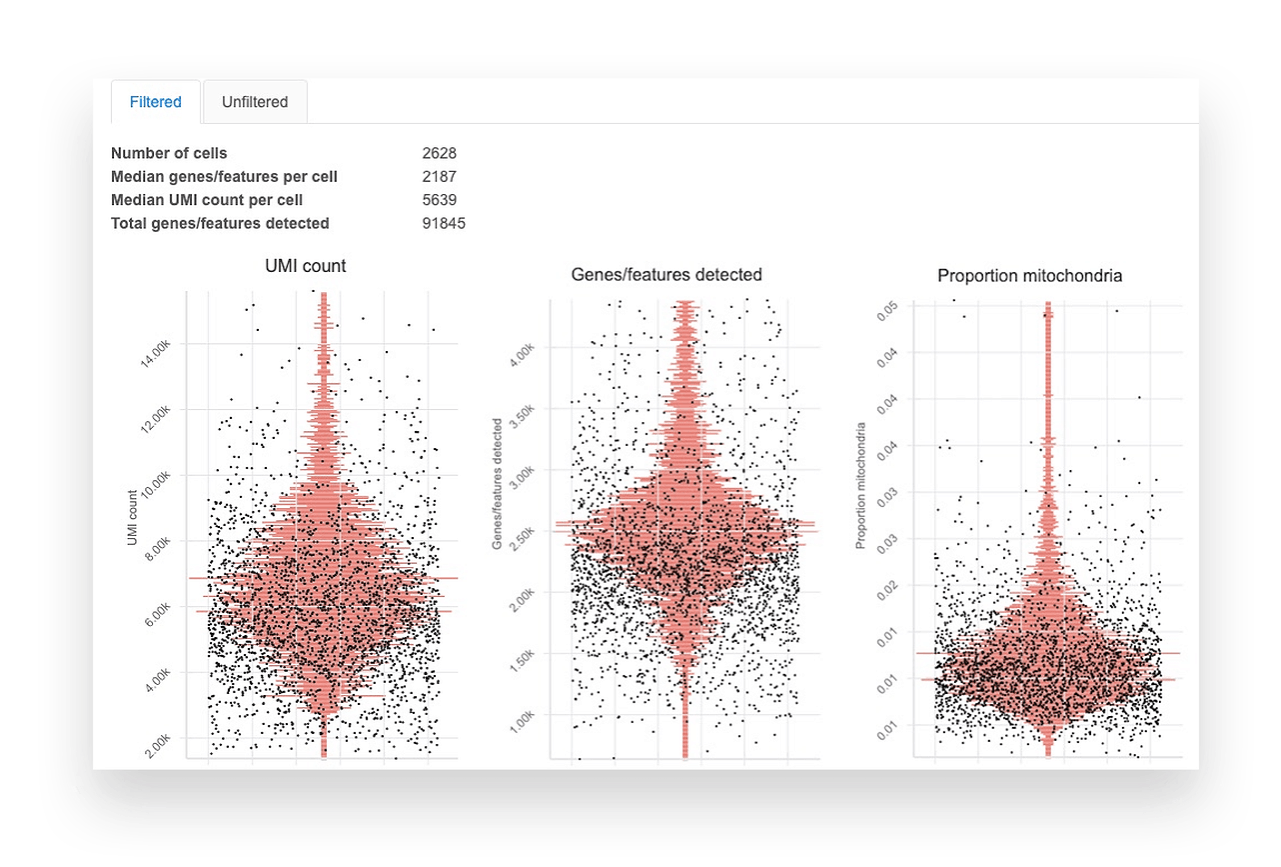
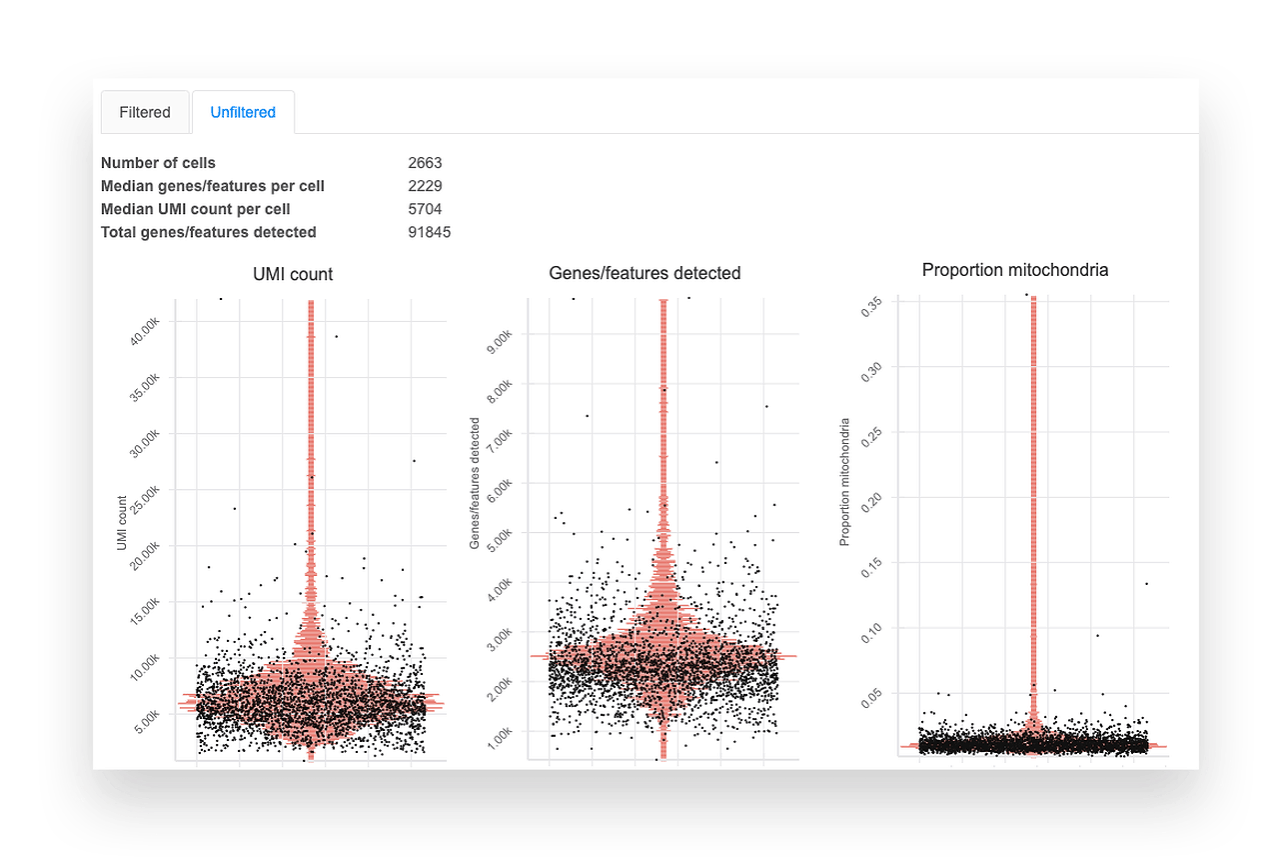
Basepair’s single cell RNA-seq analysis report includes boxplots that show the per-cell quality metrics.
- Genes/features detected shows the number of unique genes detected per cell. Very low unique genes can indicate empty droplets, while very high values can indicate droplets with two or more cells.
- UMI counts show the number of unique molecules detected per cell. Very low or high values indicate consequences similar to those of unique genes.
- Mitochondrial proportion is the proportion of reads mapping to the mitochondrial genome. Values higher than 0.1 can indicate low-quality or dying cells.
Generally, you want to remove outliers and see cells clustering into one group. Although we provide sensible default filtering thresholds, we show the data before and after filtering so you can assess the results yourself.
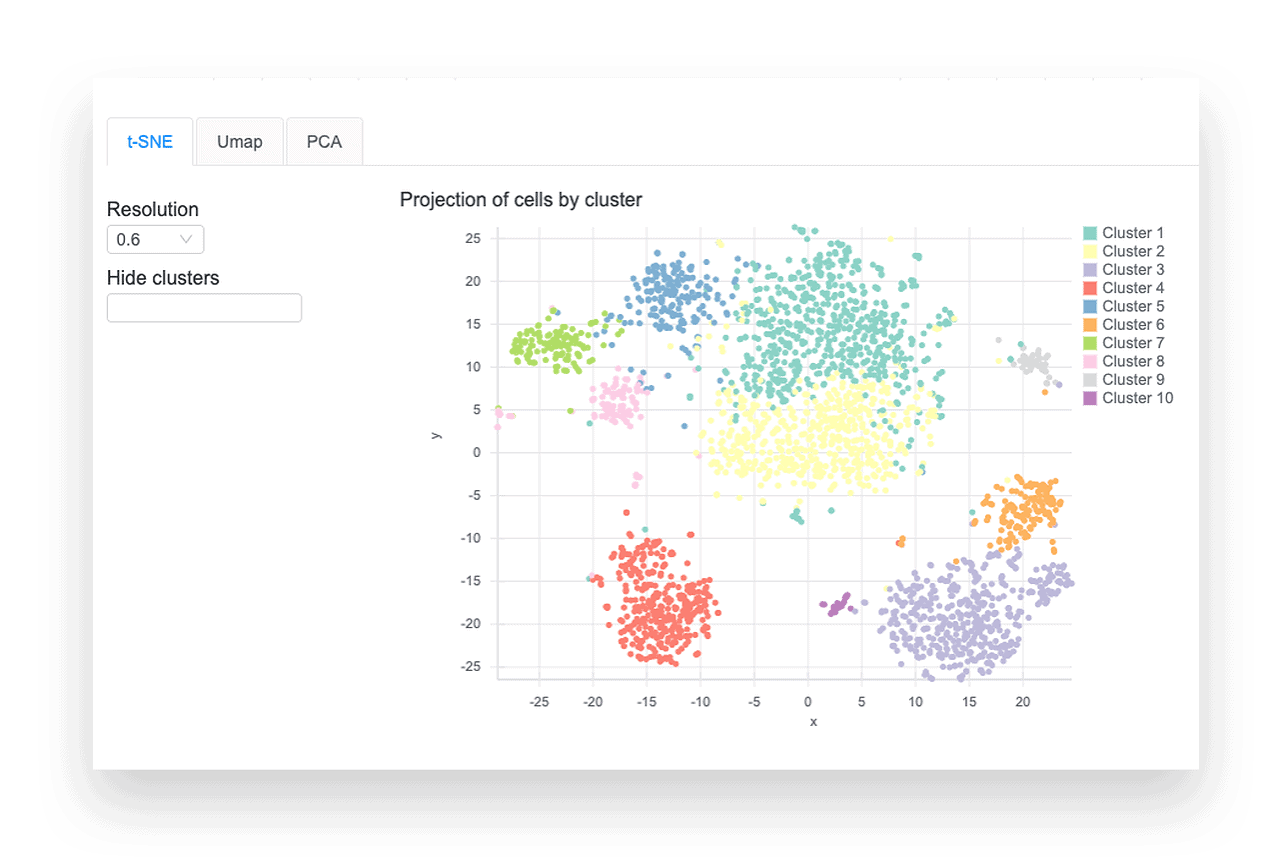
CLUSTERING & VISUALIZATION
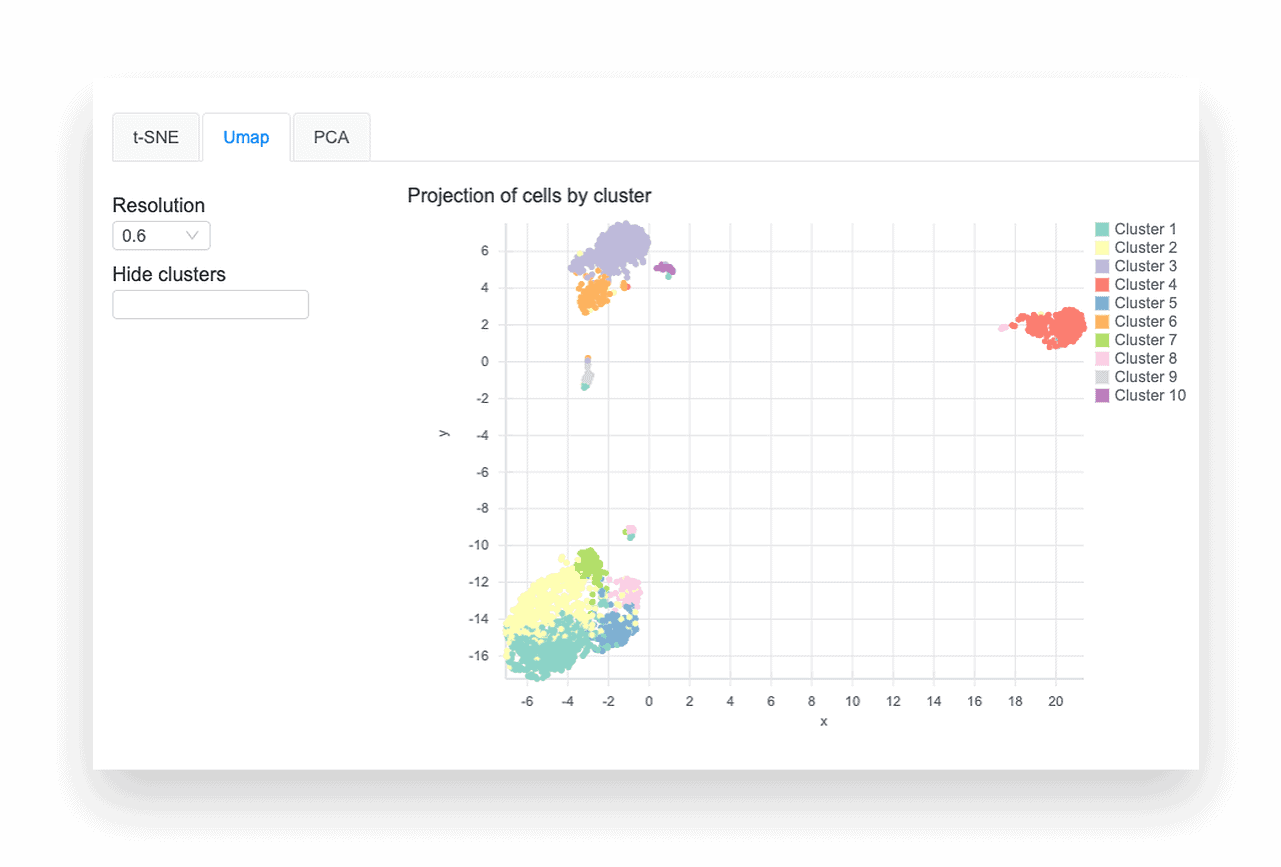
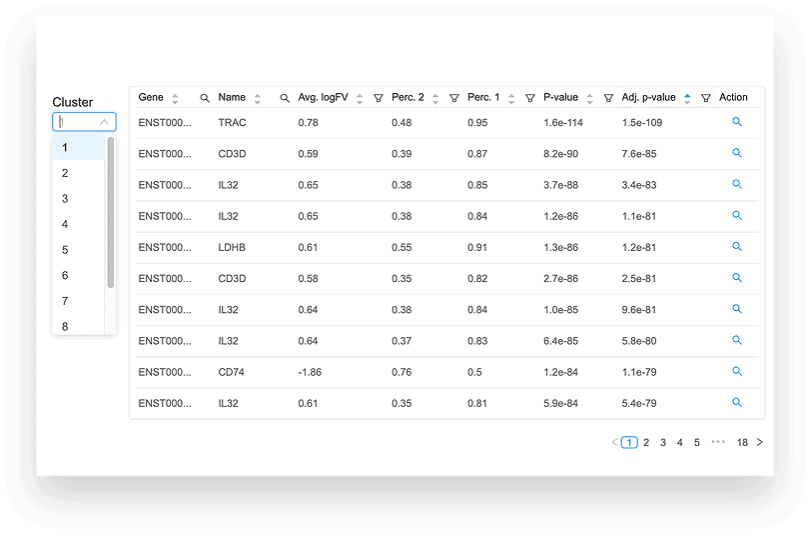
DIFFERENTIAL EXPRESSION ANALYSIS
The differential expression tables show genes that are uniquely up- or down-regulated in each cluster of the t-SNE and UMAP plots. The analysis compares each cluster of cells to all other clusters, outputting log2 fold change, p-value, and adjusted p-values for each gene. Particularly useful metrics here are the log2 fold change and adjusted p-value. They indicate the magnitude of the gene’s expression change and reduce the chance of a false positive, respectively.
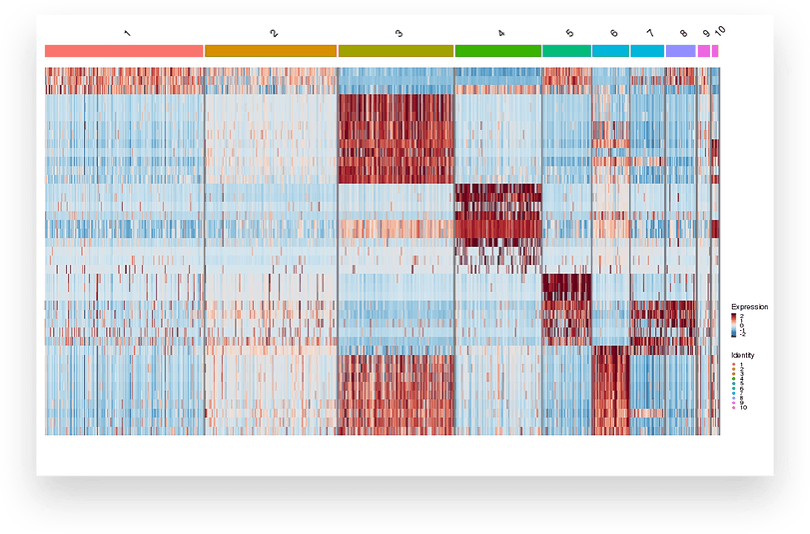
UPREGULATION ACROSS GENES
Frequently Asked Questions
How can I analyze single cell RNA-seq data on Basepair?
Single cell RNA-seq data can be quickly analyzed on Basepair using our single cell analysis pipeline. Create an account, upload your fastq files, and click run. The pipeline will automatically align reads, extract barcodes, and cluster and visualize your data.
How do I interpret single cell RNA-Seq data?
When interpreting results, it is important to look at quality control metrics. Basepair’s single cell RNA-seq report includes per-cell quality metrics like genes/features detected, UMI counts, and mitochondrial proportions. Using clustering and visualization tools, you can visualize the expression of genes across clusters. Learn more about interpreting single cell RNA-seq data in our Resources section.
What software do you use in the pipeline?
Our single cell RNA-seq pipeline uses UMI-tools for extracting barcodes, the STAR tool for alignment, fastp for QC, and Seurat for clustering and visualization. All pipelines are built using highly cited and peer-reviewed tools. Additionally, we validate all our pipelines using publicly available datasets. Read more about how we validated our single cell pipeline here.
Can I upload two samples of single cell RNA-seq data (treatment and control) and compare them?
Basepair has a pipeline called “Single cell RNA-seq integrate” that allows users to upload multiple replicates to both the treatment and control group. Basepair will individually analyze all samples, and then combine these samples in a count matrix that will show the differentially expressed clusters across two groups.
How are default analysis options chosen? How can I avoid a bias in the analysis?
Basepair sets parameters based on the recommended default values from published tools we use in our pipeline. These parameters work for most datasets, and most users will not need to modify these parameters.
Is it necessary to confirm results with some other experiments?
We always advise to confirm your key results with other sets of data or analyses; ideally, using different types of technologies (e.g. molecular assays). All bioinformatic tools have some degree of inaccuracy. Having multiple, parallel sets of results supporting your conclusion is just better science.
Do you check the relationship between nUMI vs nGenes plot? Do you have a specific threshold in this graph?
We do not explicitly check the relationship between nUMI and nGenes, but we do provide thresholds to remove genes with too high or too low nUMI or nGenes. In order to deal with the variety of datasets Basepair receives, we use the simple approach of removing cells that are +/- 3 standard deviations away from the median for nUMI and nGenes, separately. However, you can override these default thresholds with your own.
How do you account for technical variability? Does the program fit for mean variance trend, test for non zero biological variability, or deconvolution based normalization?
Gene expression is first normalized to account for total expression within each cell then applies a log transform. Then to select genes for downstream unsupervised analyses (e.g. PCA, t-SNE), the expression values are corrected for heteroscedasticity using the variance stabilizing transformation (VST). We also apply a method to regress out the per-cell measures of total UMI counts, total genes detected, and percentage of reads mapping to mitochondria.
Can you toggle between t-SNE, violin plots and table for individual genes?
Yes, you can either search for your gene or click on the magnifying glass on the right-hand side of the table. This will update the t-SNE plot by coloring each cell with the expression level of the gene. The violin plot will also plot the expression of the gene broken by the clusters shown in the t-SNE plot.
Won't filtering out reads affect the differential expression analysis?
Yes, but in a good way. Read filtering helps remove cells that are poor quality (e.g. dead or dying) and reads originating from ambient RNA, both of which can negatively affect differential expression. Filtering is performed using UMI-tools, which first groups reads that have the same barcode (each group ideally represents one cell).
Can you prepare tables for posting in data repositories as required for publication?
Yes, we have an automated pipeline called “Copy data to GEO” that will automatically send the required files to NCBI for submission.
Take Your Single Cell RNA-seq Analysis to the Next Level With Basepair
For every week spent waiting for someone else to process your data, or for every hour spent feeding genomics data into algorithms, converting file formats, waiting for everything to finish processing to move onto the next step, you’re taking away valuable time that could be used to delve into your research further. Why not put yourself in the driver’s seat and automate your scRNA-seq analysis process with Basepair?
Scientists All Over the World Trust Basepair