
Key features
We are pleased to announce the release of Basepair’s significantly updated single cell RNA-seq (scRNA-seq) pipeline. It brings many improvements in new features, efficiency, and user friendliness:
1. Seurat version 3
- Version 3 of the scRNA-seq software we use, Seurat, has recently been released [1]. Our pipeline now takes advantages of many of its improvements.
2. Faster and more interactive reports
- Reports now show clustering with UMAP in addition to PCA and t-SNE.
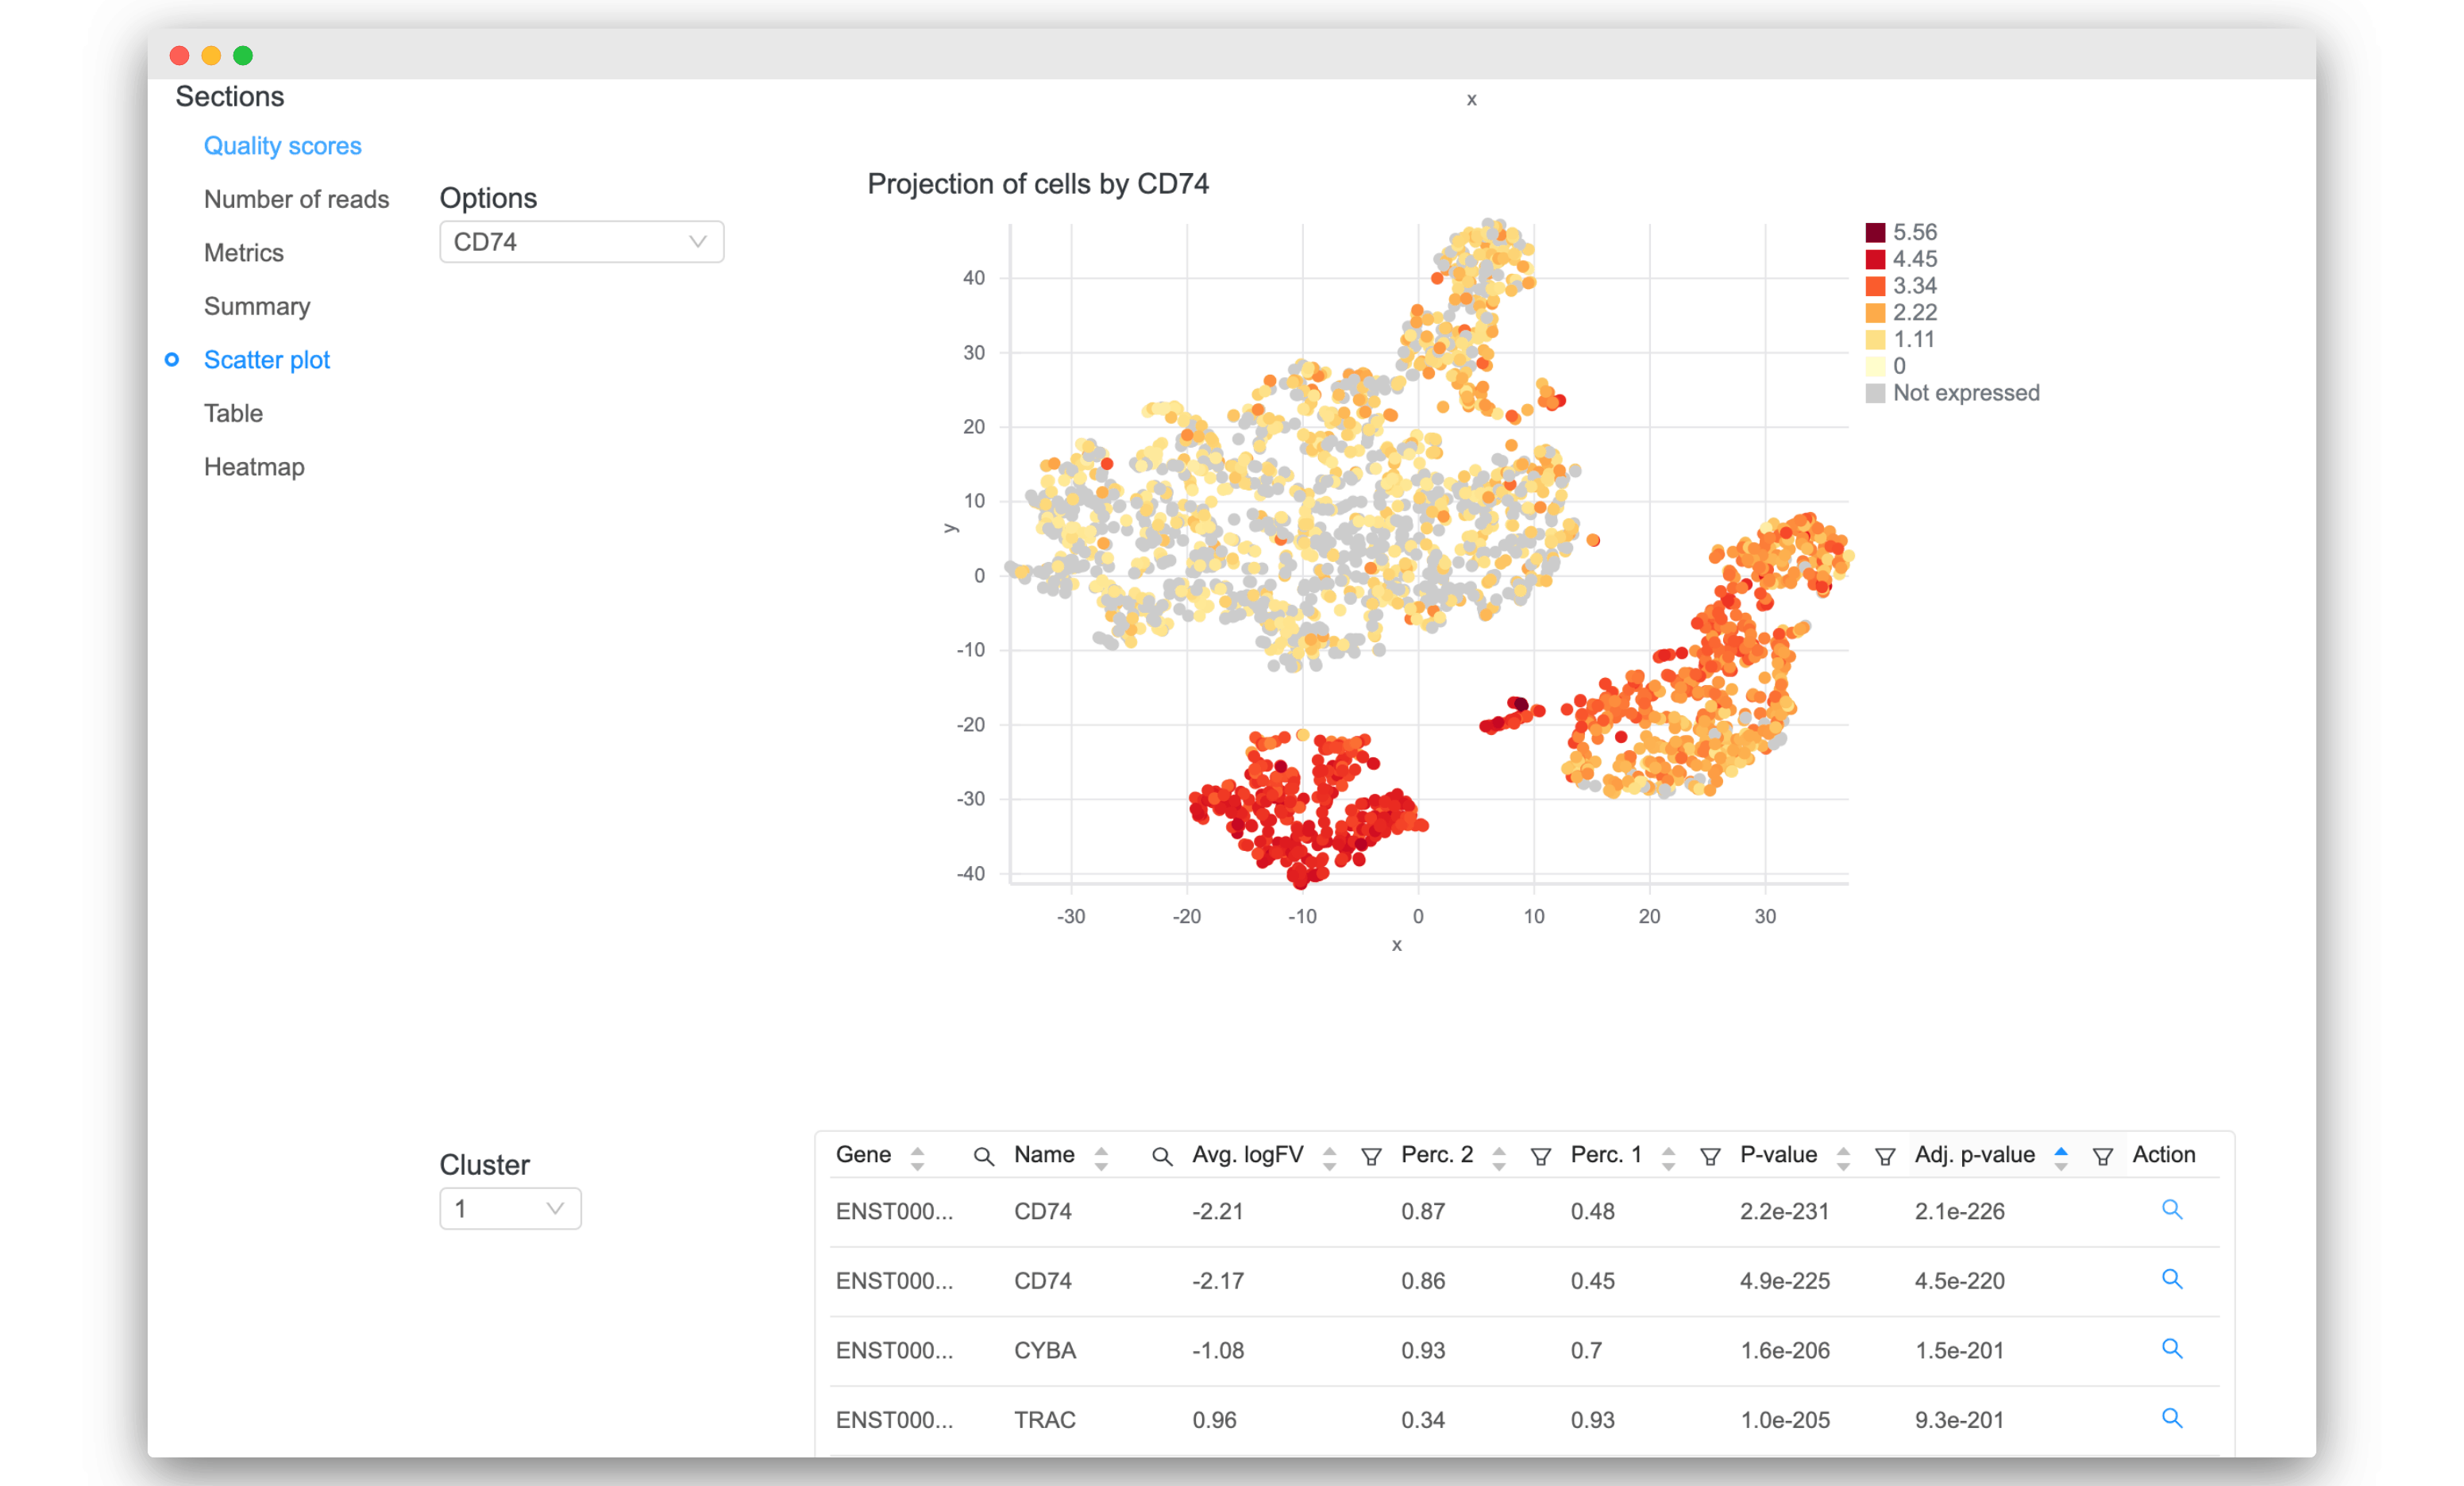
- Quickly search your favorite gene to visualize its expression across cells
- Sort and filter the tables of differential expression results. Click on the magnifying glass icon under the “Action” column to visualize it.
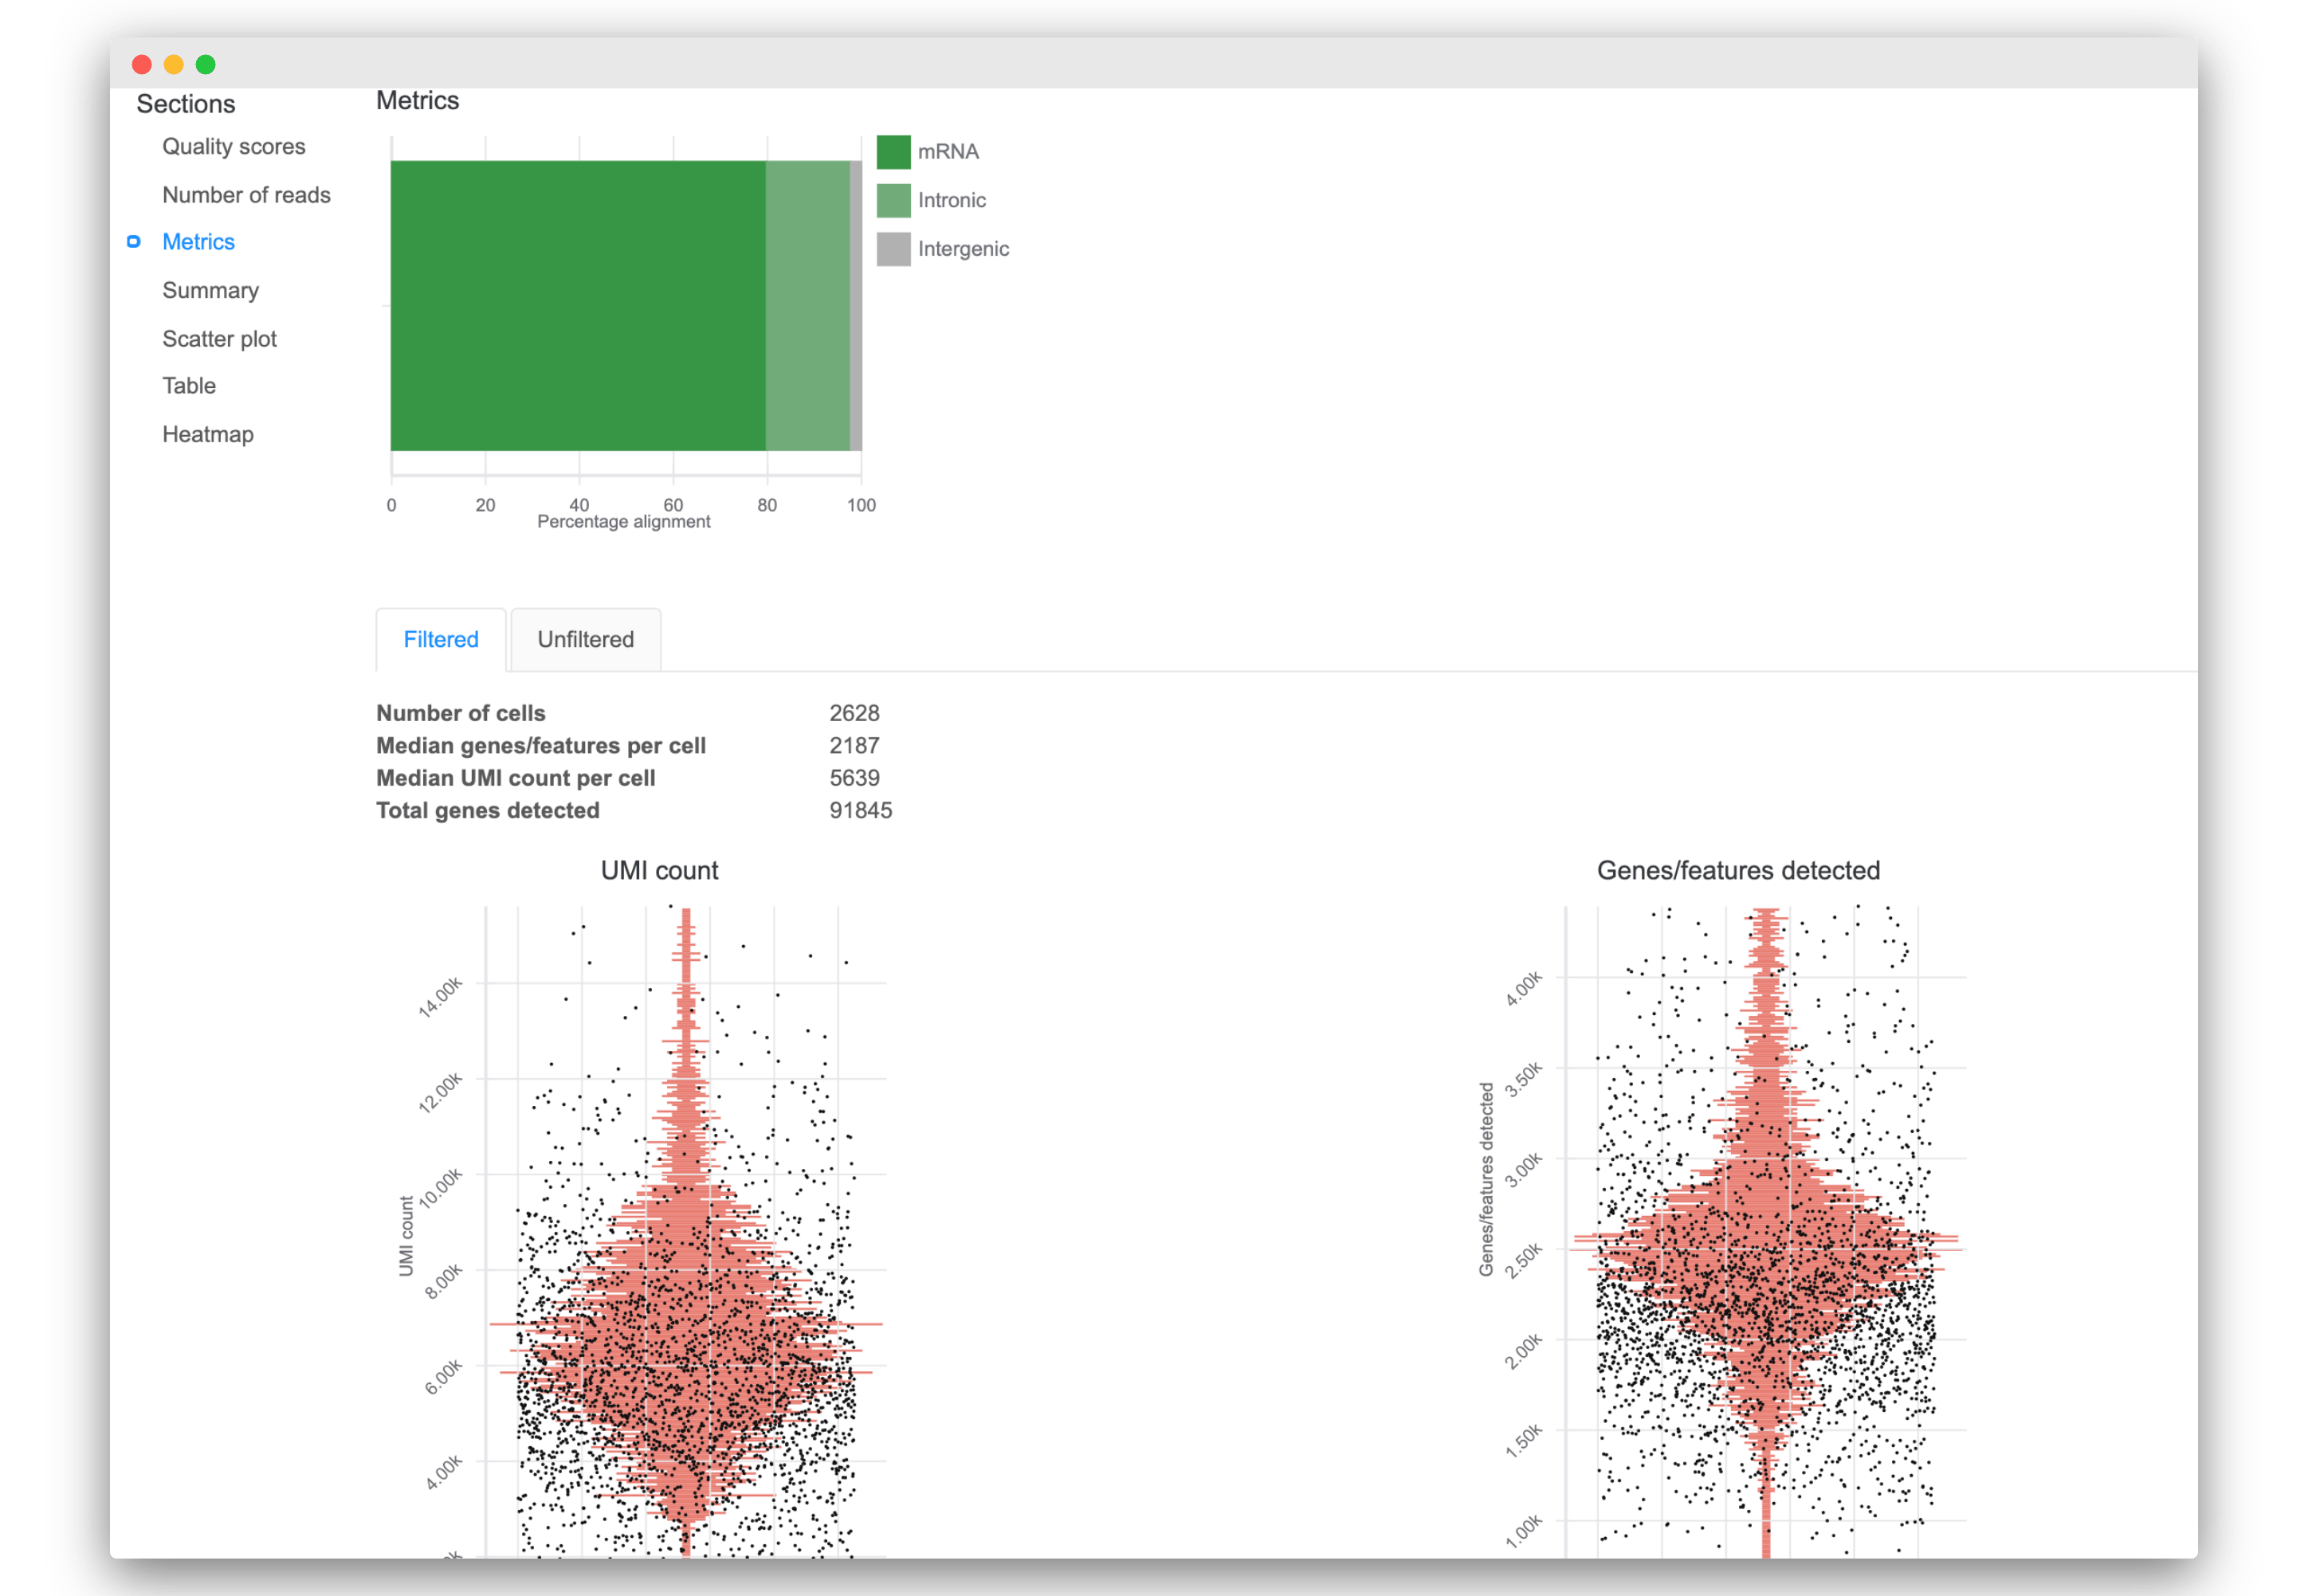
3. Improved data quality reporting
- Interact quickly with updated visualizations of read quality and mapping metrics
- View additional reporting statistics like number of cells, total genes detected, median UMI count per cell, and more.
- Access new visualizations of key quality metrics for each cell:
- UMI counts
- Genes/features detected
- Mitochondria proportion (if available)
Validation
Here we demonstrate the validity of our pipeline using a publicly available dataset. We used the peripheral blood mononuclear cells (PBMC) dataset from 10X Genomics that contains ~2,700 cells. This dataset has been analyzed before by the authors of Seurat and the results are publicly available online here [2]. The steps in our updated scRNA-seq pipeline are shown in Figure 1.
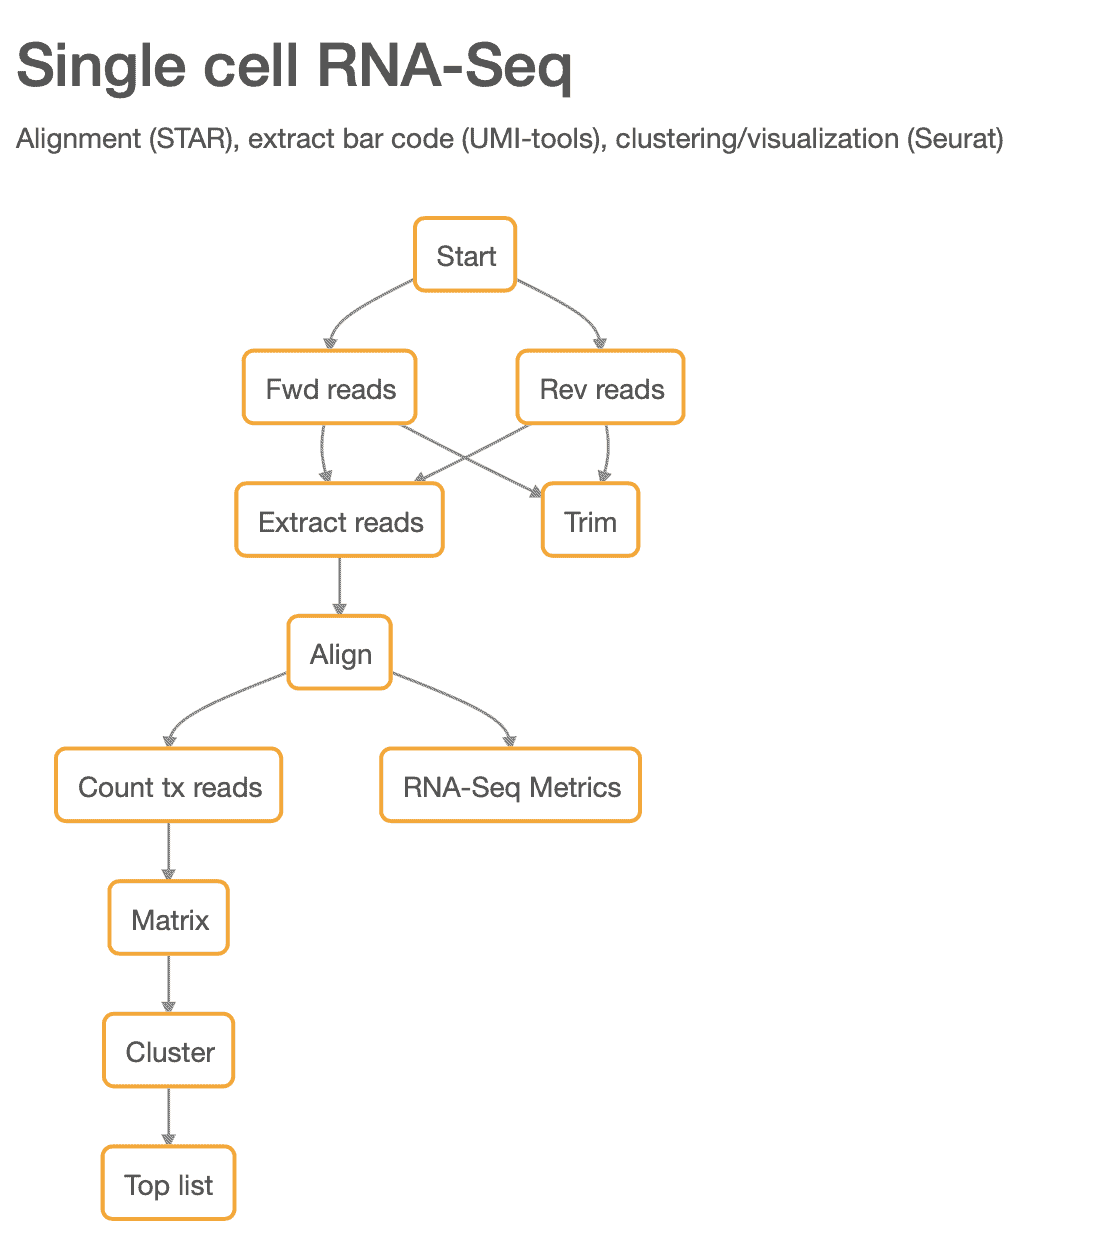
Figure 1: The new scRNA-seq pipeline.
One of the key analyses in any scRNA-seq analysis is showing how cells cluster together. This is typically done with either the t-SNE or UMAP algorithms. Figure 2 compares the UMAP results from our pipeline against those reported by the Seurat authors. Overall, the number of clusters and their relative position to each other is basically identical. There are some slight differences because their data was preprocessed using the 10x Genomics workflow.
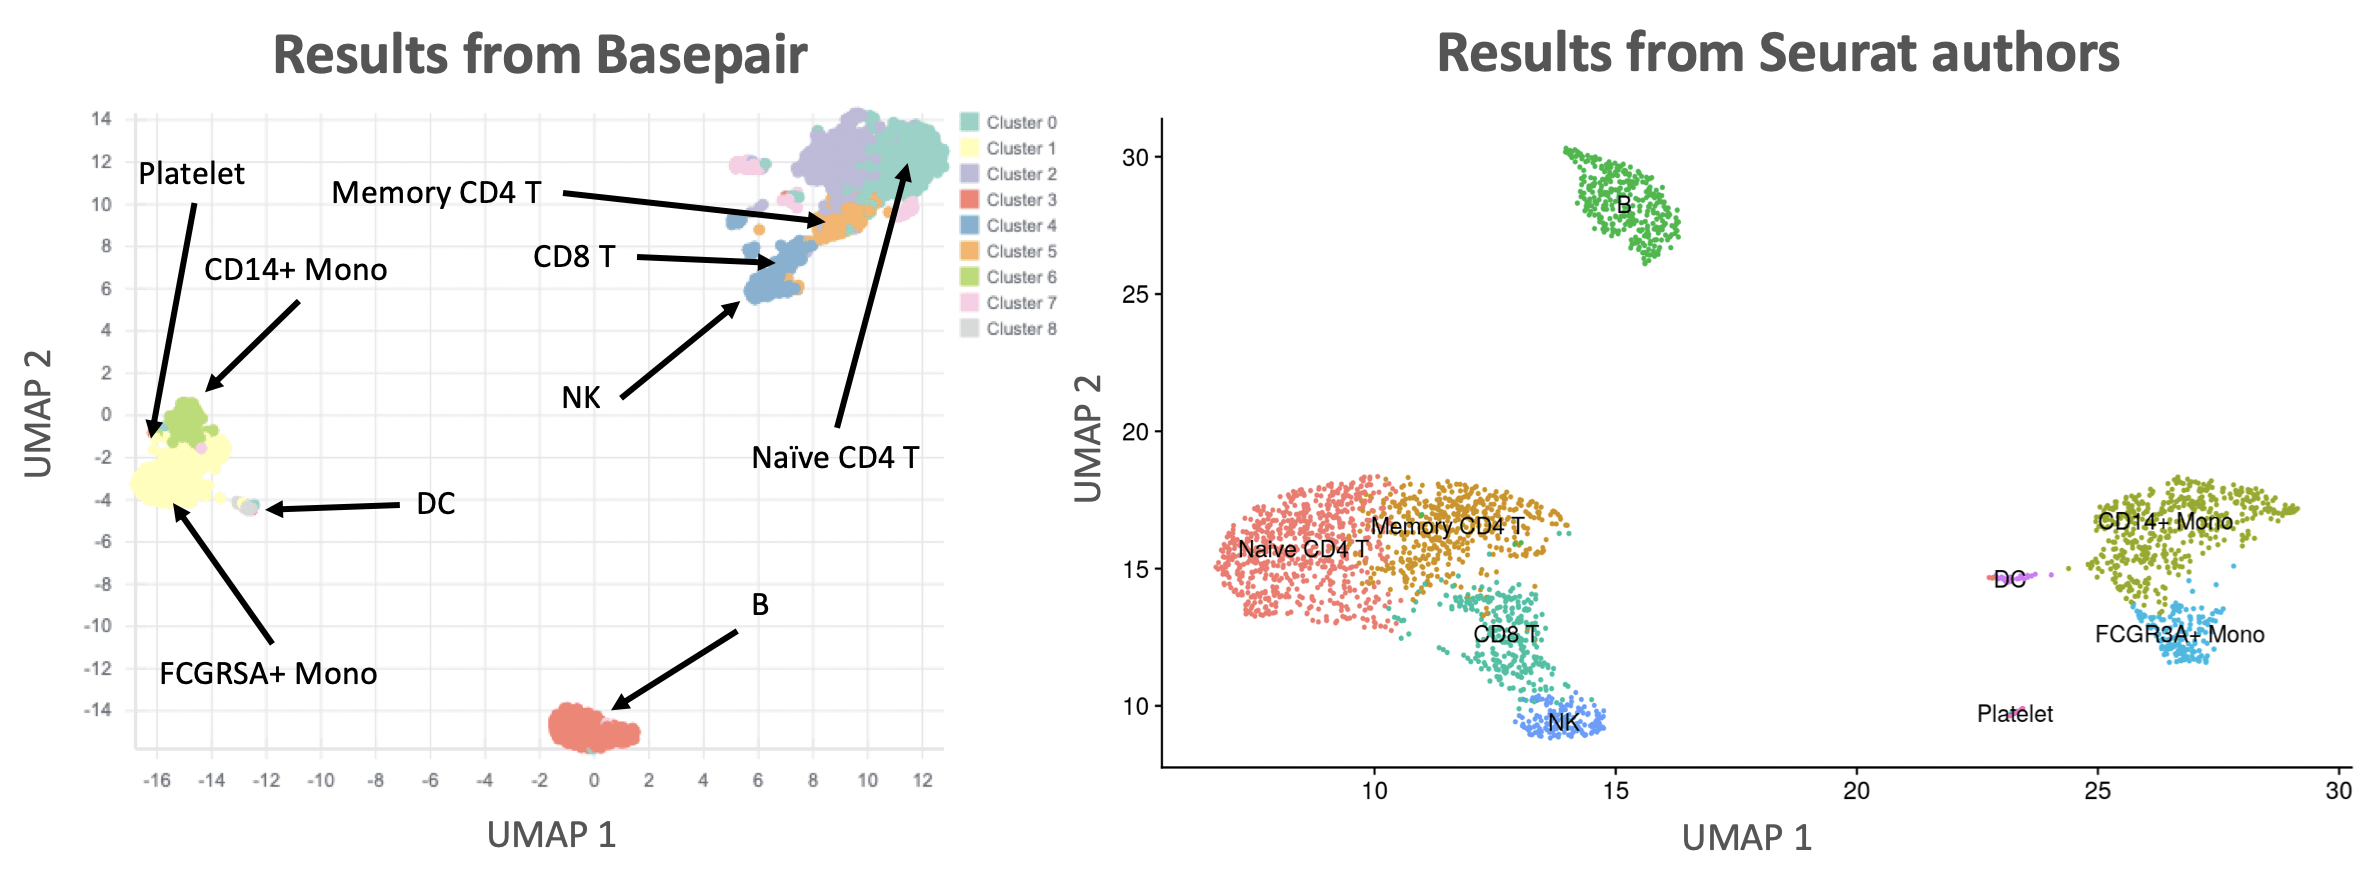
Figure 2: Comparison of UMAP results. Left: Basepair results. Right: Seurat author results. Both plots label the identified cell types.
Two additional analyses commonly done with scRNA-seq are (1) differential expression between groups and (2) visualizing a gene’s expression pattern across the cells. The Seurat authors plotted nine genes that they found were differentially expressed between the clusters (Figure 3). You can see that the expression of each gene is restricted to certain groups of cells. We performed the same analysis and plotted the expression pattern of those same nine genes (Figure 4). You can see similarity between the two sets of figures.
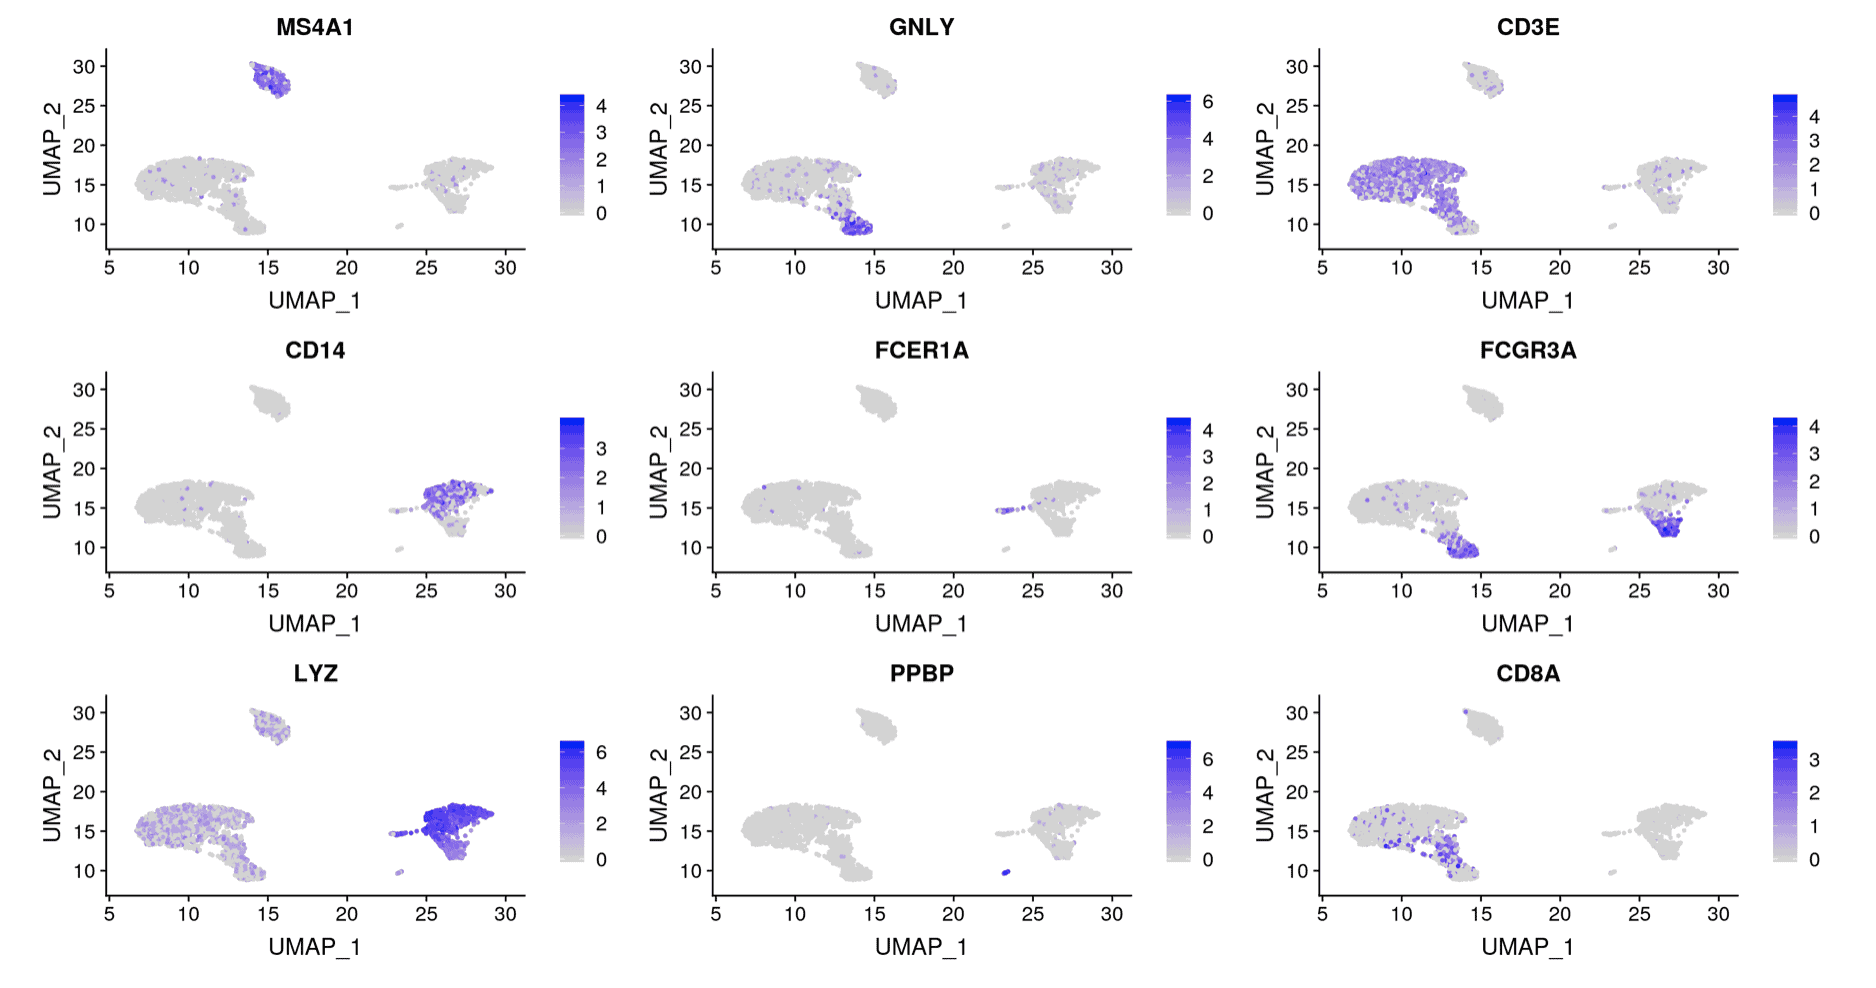
Figure 3: Results from Seurat authors. Plot of expression values for nine differentially expressed genes identified in the analysis by the Seurat authors.
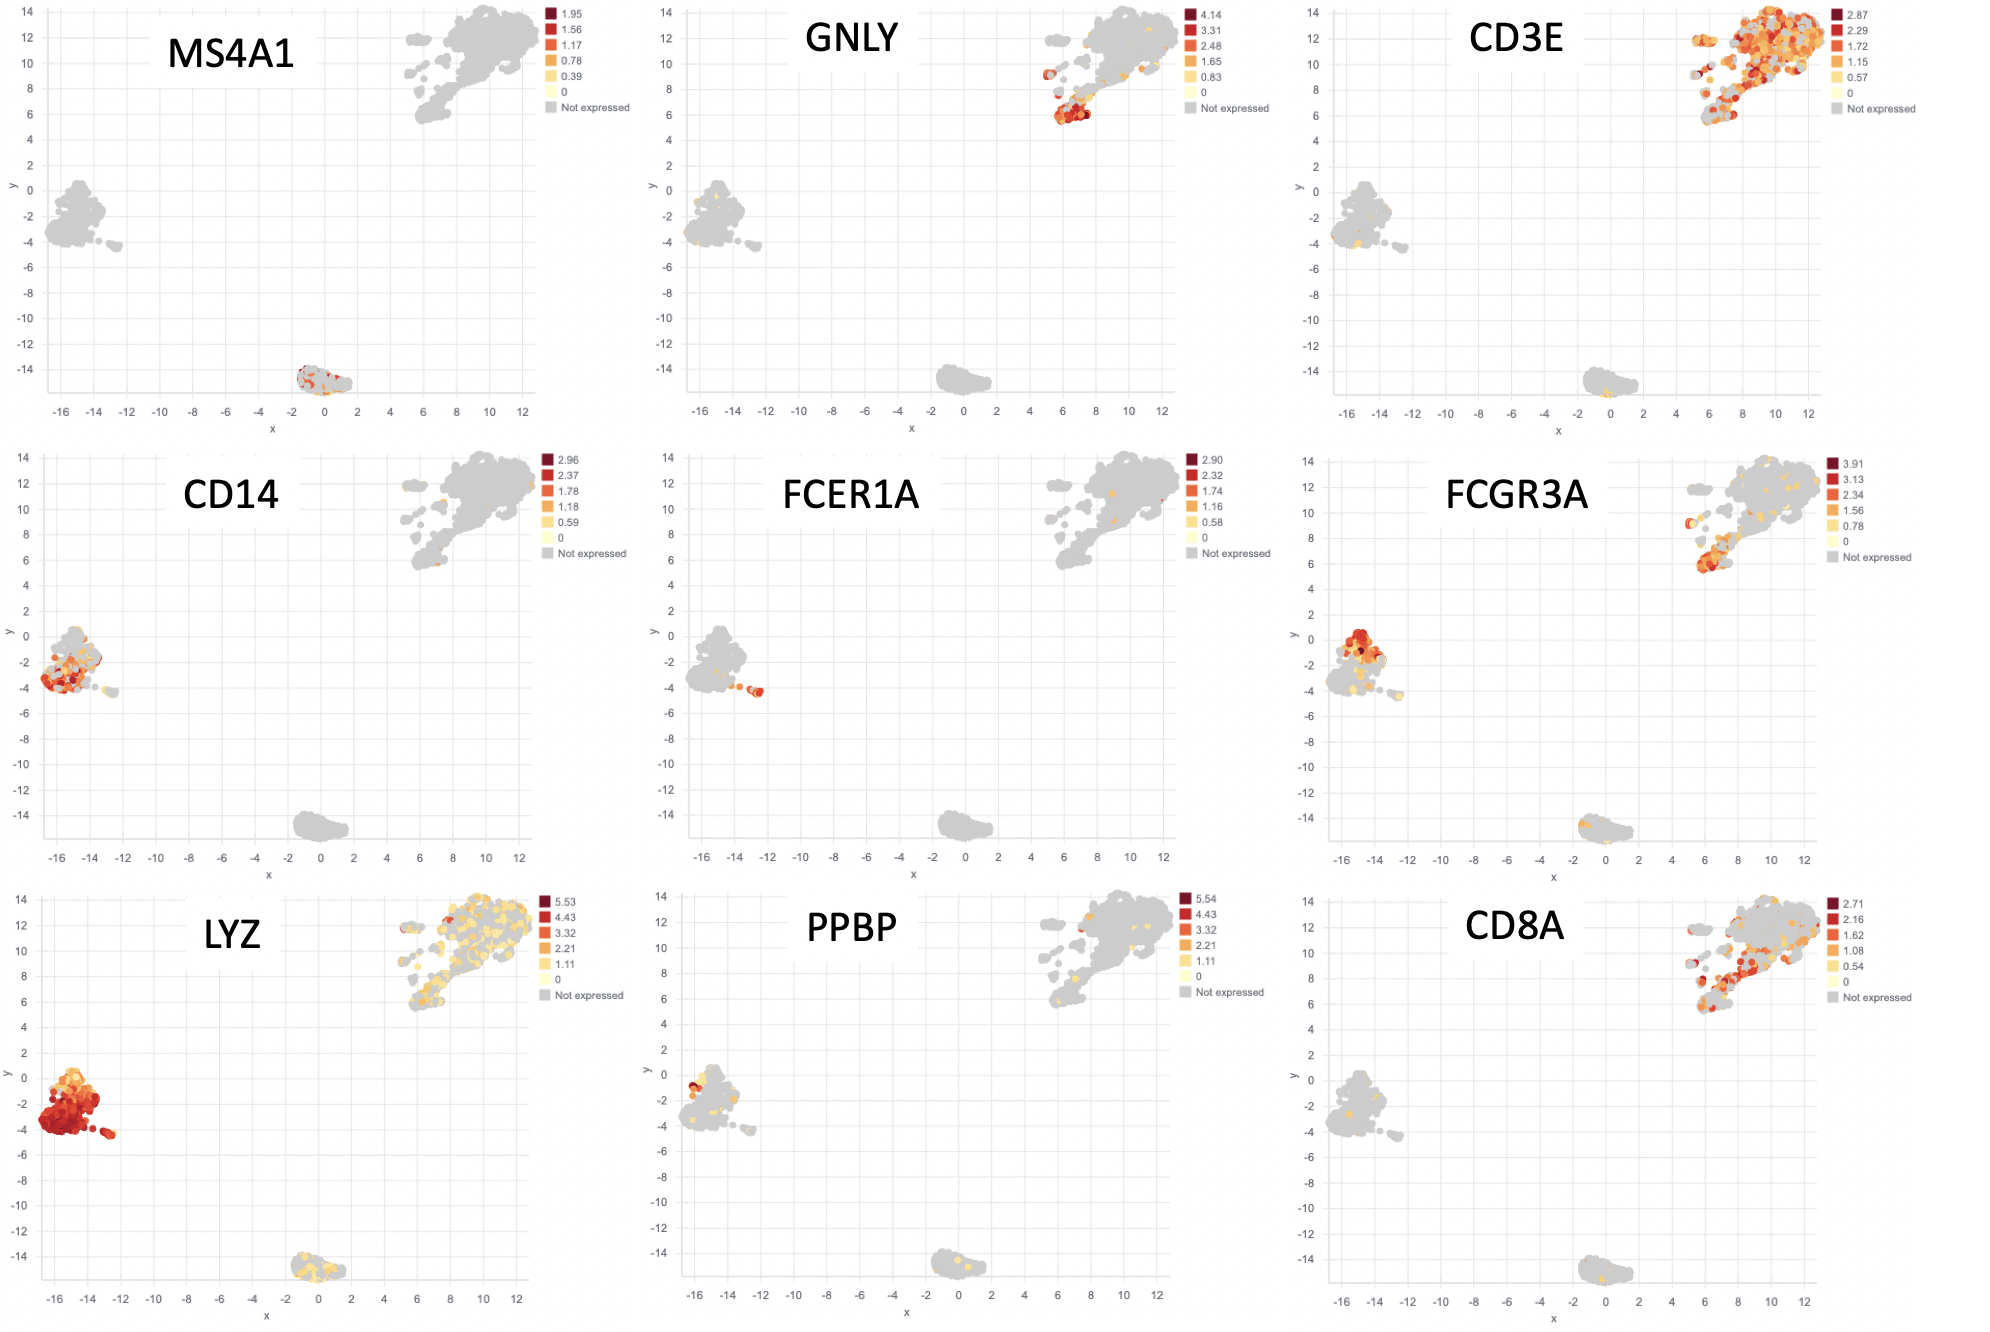
Figure 4: Results from Basepair. The same 9 genes from Figure 3, but plotted using the data from Basepair’s analysis.
Future work
Seurat version 3 also came with exciting new tools to merge independent scRNA-seq datasets. We are currently working on adding a pipeline to Basepair to make use of that functionality. Stay tuned!
In the meantime, head over to app.basepairtech.com and try our updated single cell RNA-seq pipeline yourself.
References