The RNA-Seq Analysis & Visualization Platform For Both Bench Scientists and Bioinformaticians
Go from data upload to data exploration through interactive visualizations in just a few clicks, no bioinformatics or coding experience needed. Basepair’s automated pipelines will handle all the intermediary steps for you, including QC, alignment, differential expression and more. However, if you want finer grained control and extensibility, then Basepair comes with enterprise features such as the CLI & API access at any usage level.
“We had very specific needs for quick and easy analysis. Most of the data we needed to analyze was on the RNA-seq side and it fell on me to take care of it. I didn’t have a whole lot of time to sit there and write scripts…I just wanted to be able to click one button to run an analysis pipeline”
Andrew Hillhouse
Associate Director
Texas A&M Institute for Genome Sciences and Society (TIGSS)
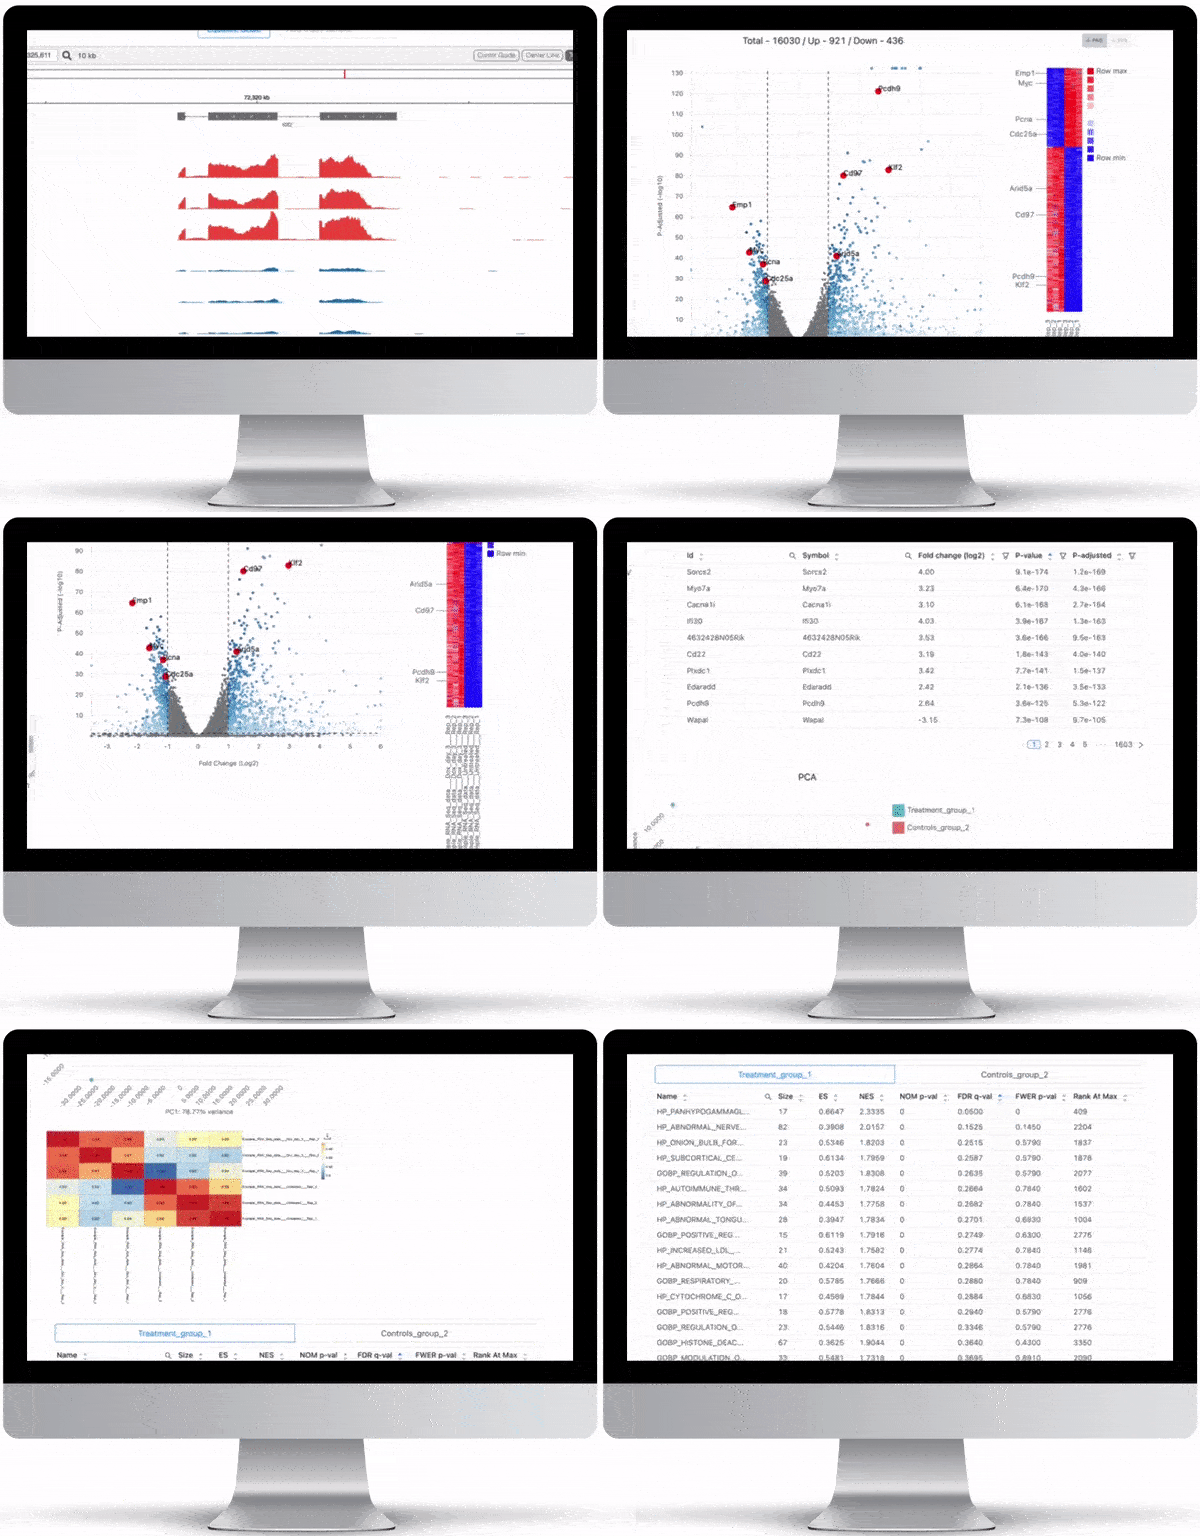
Easy as 1, 2, 3. Upload, analyze, visualize.
We wanted to make RNA-Seq data analysis so simple that users with no programming experience, or the time to wait for days for results, could run Basepair’s platform with ease in a controlled environment where mistakes can be minimized. Even data upload is simplified, with options to drag and drop files, connect directly to Basespace or even your own cloud storage bucket. If an interesting relationship or trend in the data is then observed, this can be taken to the bioinformatician as an informed question, streamlining collaboration within and between R&D scientists and teams across an organization.


Transparency & Reproducibility as Standard
Our audit-ready NGS data analysis platform was designed for reproducibility and transparency — from QC and read charts, to interactive plots ready for publication. All RNA-seq tools used in our out of the box pipelines such as STAR, DESeq2, Tophat and Cufflinks are industry standard, public domain algorithms that have been highly cited and peer-reviewed.
Commercial grade software at an affordable price
Let’s face it. No one likes annual software licenses unless they know they are going to use it a lot or have a lot of samples to process. At Basepair you can get started with our $40 per sample pay as you go usage model with no upfront license, making it accessible for virtually any budget. What’s more this includes everything you need – all the tools, analysis compute, unlimited access to the visualizations and even 12 months cloud storage so you can access your data anywhere, anytime.

Bad Data In, Bad Insights Out
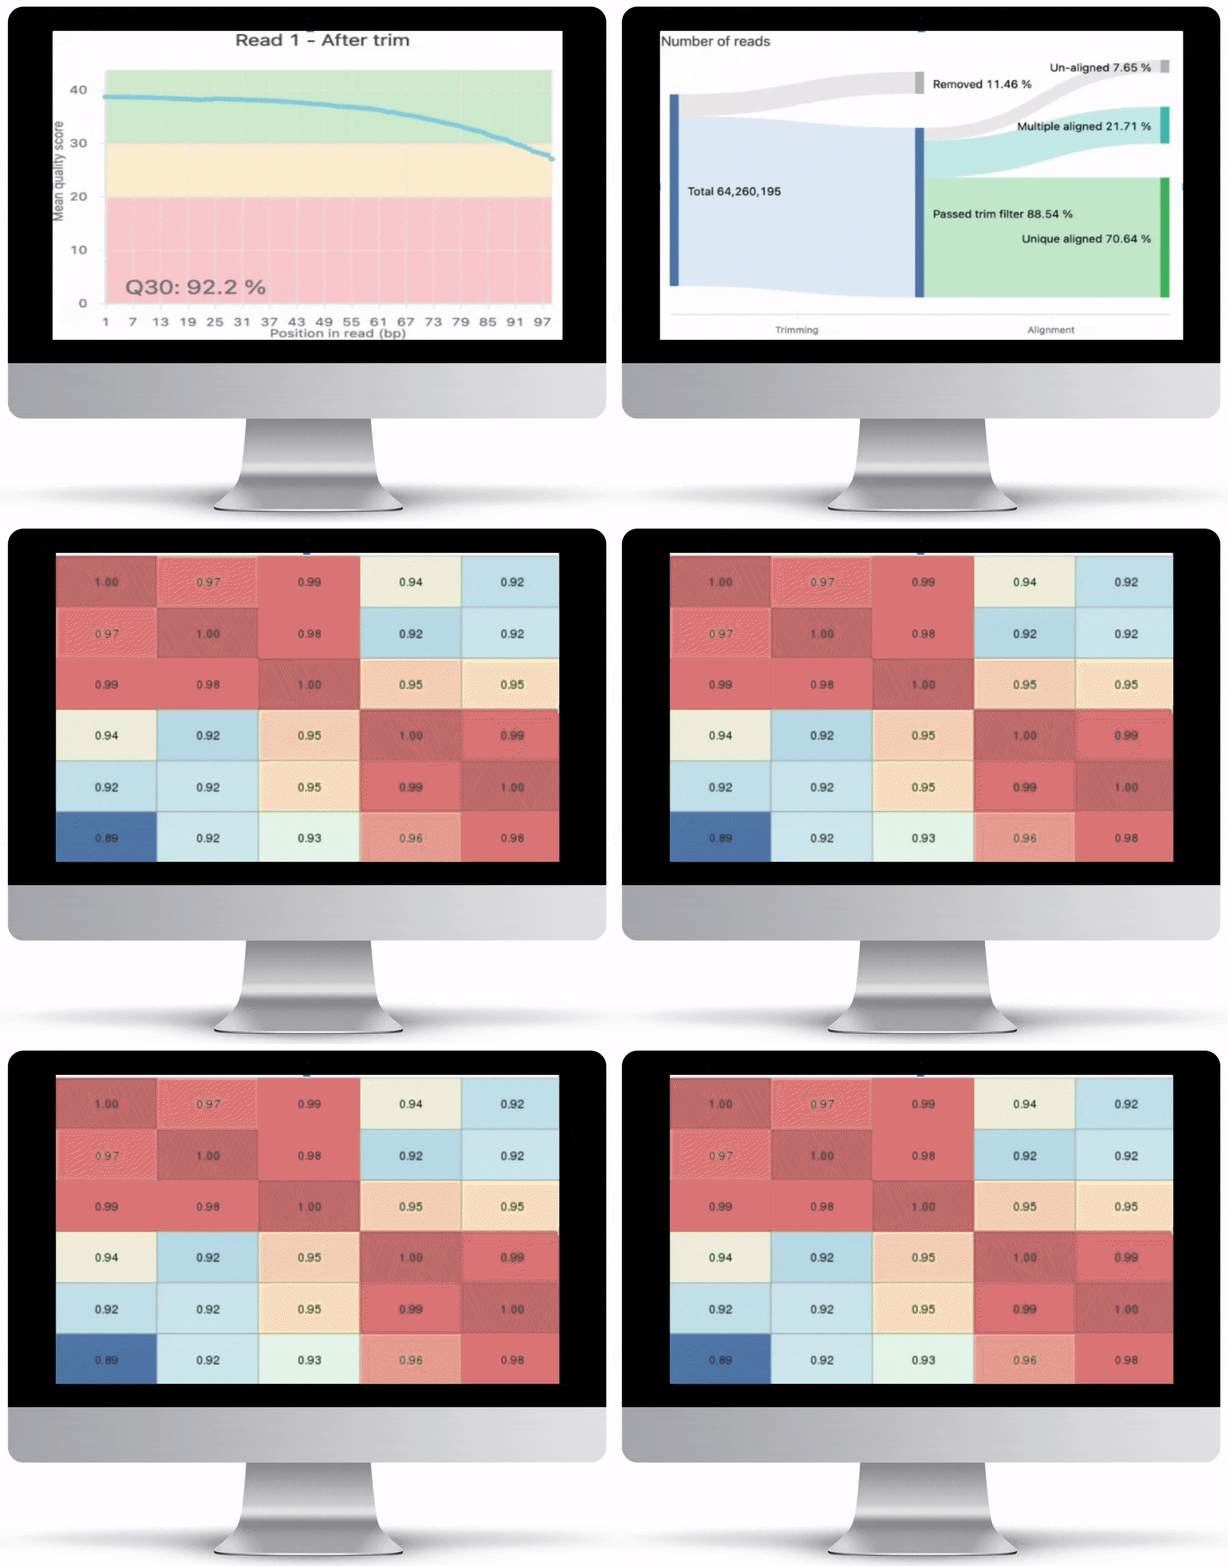
This is never so true as with NGS data. All RNA-Seq reports include QC charts, which give you an overview of the quality of your data. To ensure the highest quality output, Basepair checks the raw data and assigns a quality rating. This score reveals any contamination in the input data, as well as base distribution and other useful information.
Tracking reads is an excellent way to reveal what you’re working with — which data was trimmed, and which data is usable. Together with the QC charts, read counts provide easy-to-read, accurate insight into your raw data.
Interpretation Through Visualization
NGS is not cheap (at least not yet!). In order to maximize your investment, after generating the data, you need to have the right tools to visualize and interactively explore your data. All of the graphs, charts and figures that are part of the visualizations listed below can be downloaded as high quality, ready-for-publication images to make writing that paper or creating that presentation just a little bit easier.

Expression Count Table
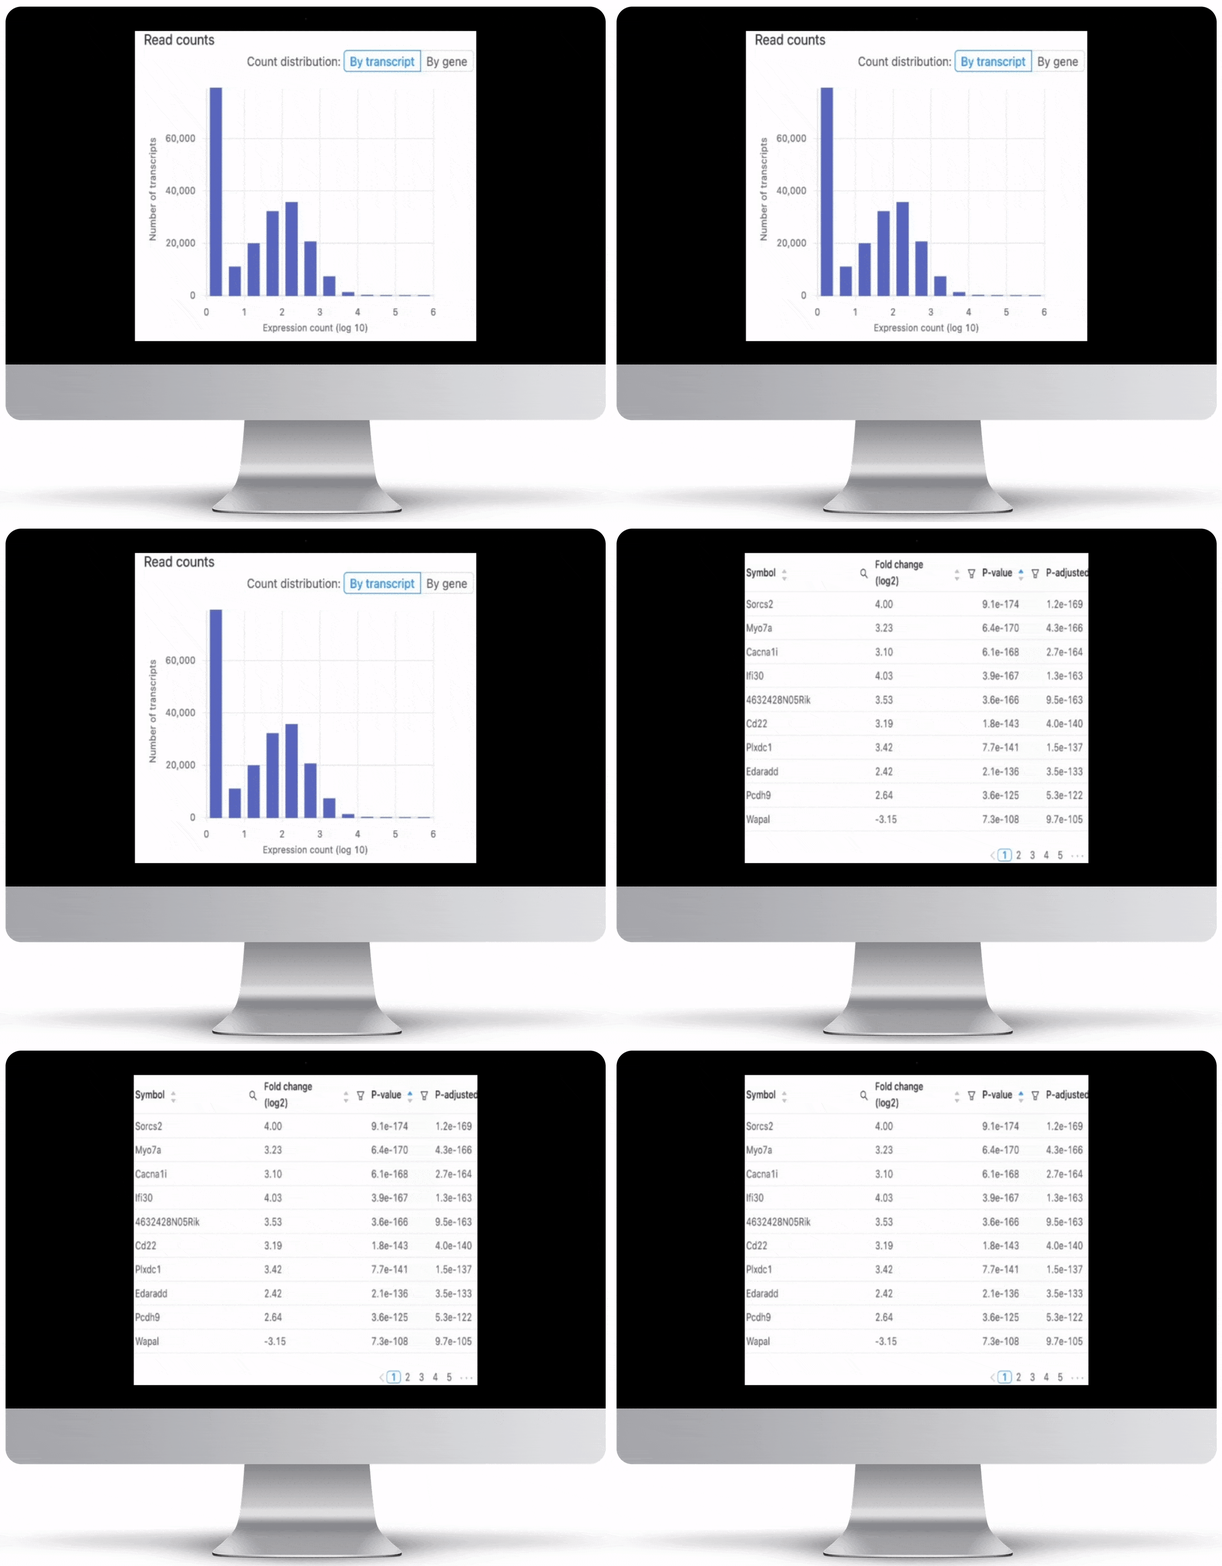
Expression count is the number of reads aligning to the exons of a gene. Your results will include both an expression count chart and table for a practical overview of the metrics for each gene.
Genome Browser
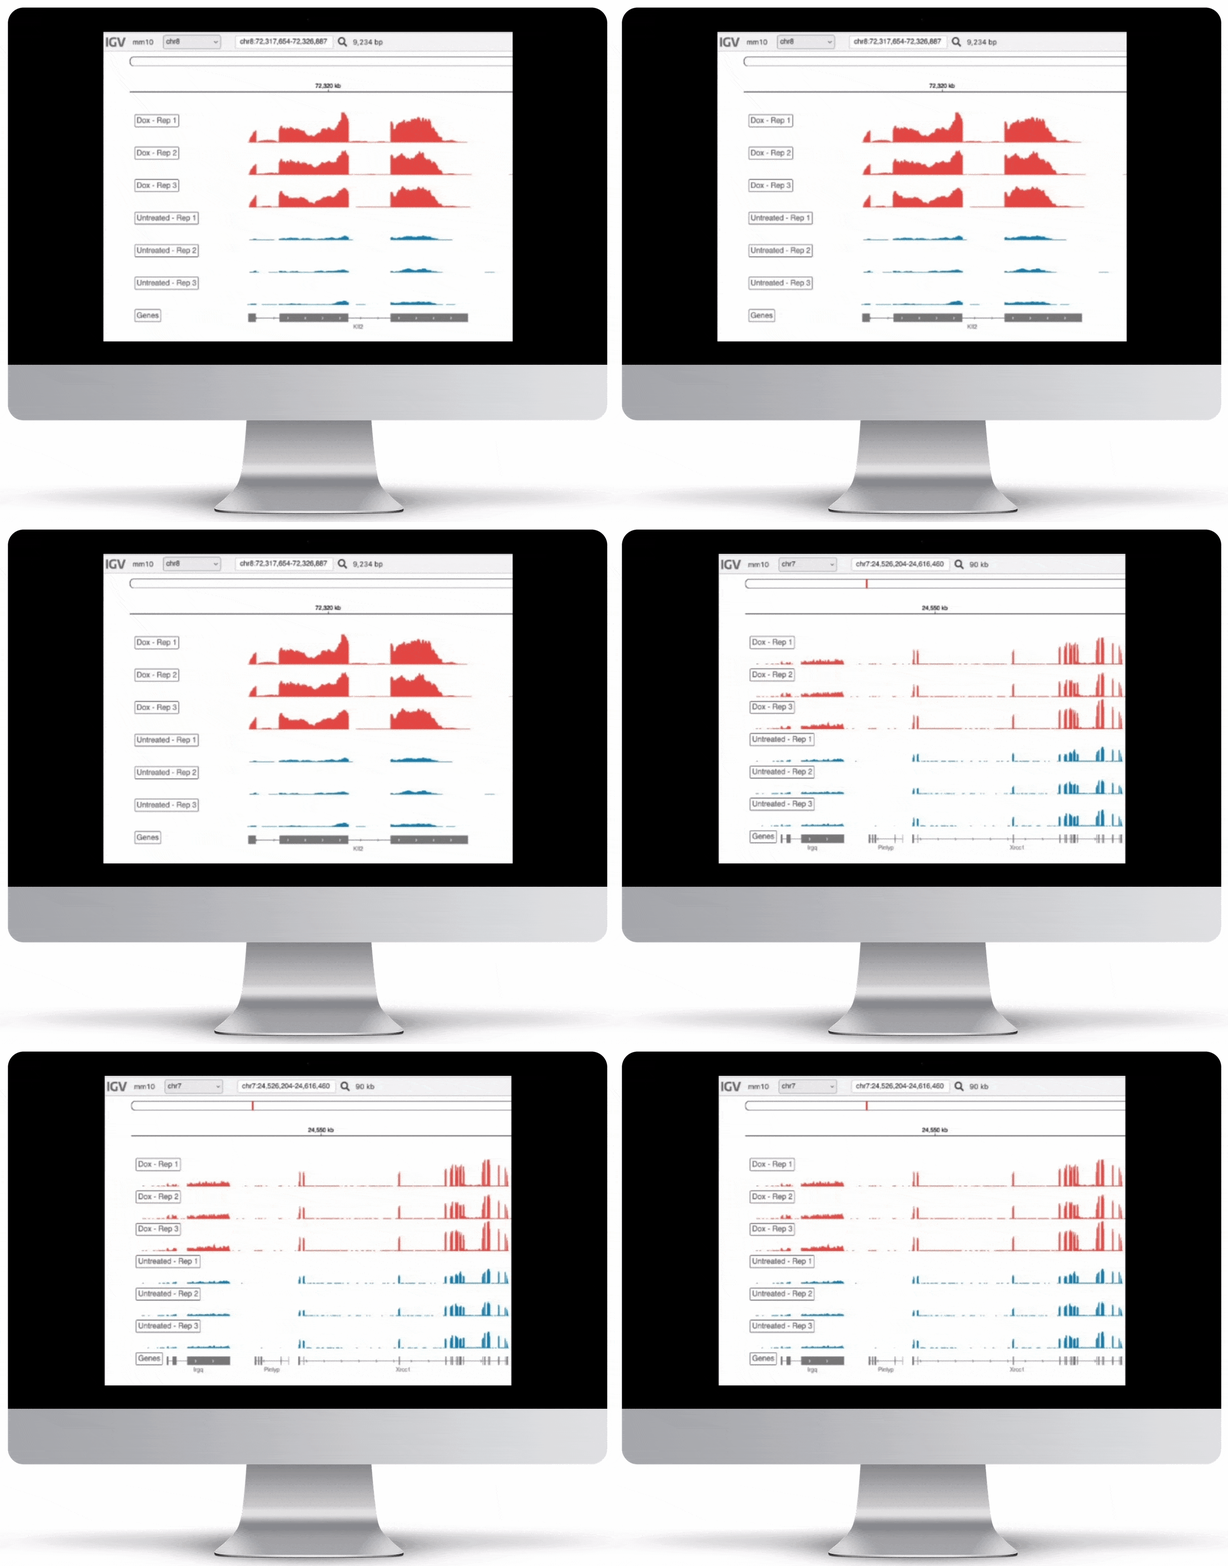
For the genome browser, aligned reads are converted to genome coverage, expressing the number of reads at each position in the genome. This interactive plot provides a birds-eye view of your raw data, without the need to convert files for visualization – Basepair automatically does everything under the hood.
Volcano Plot & Heatmap
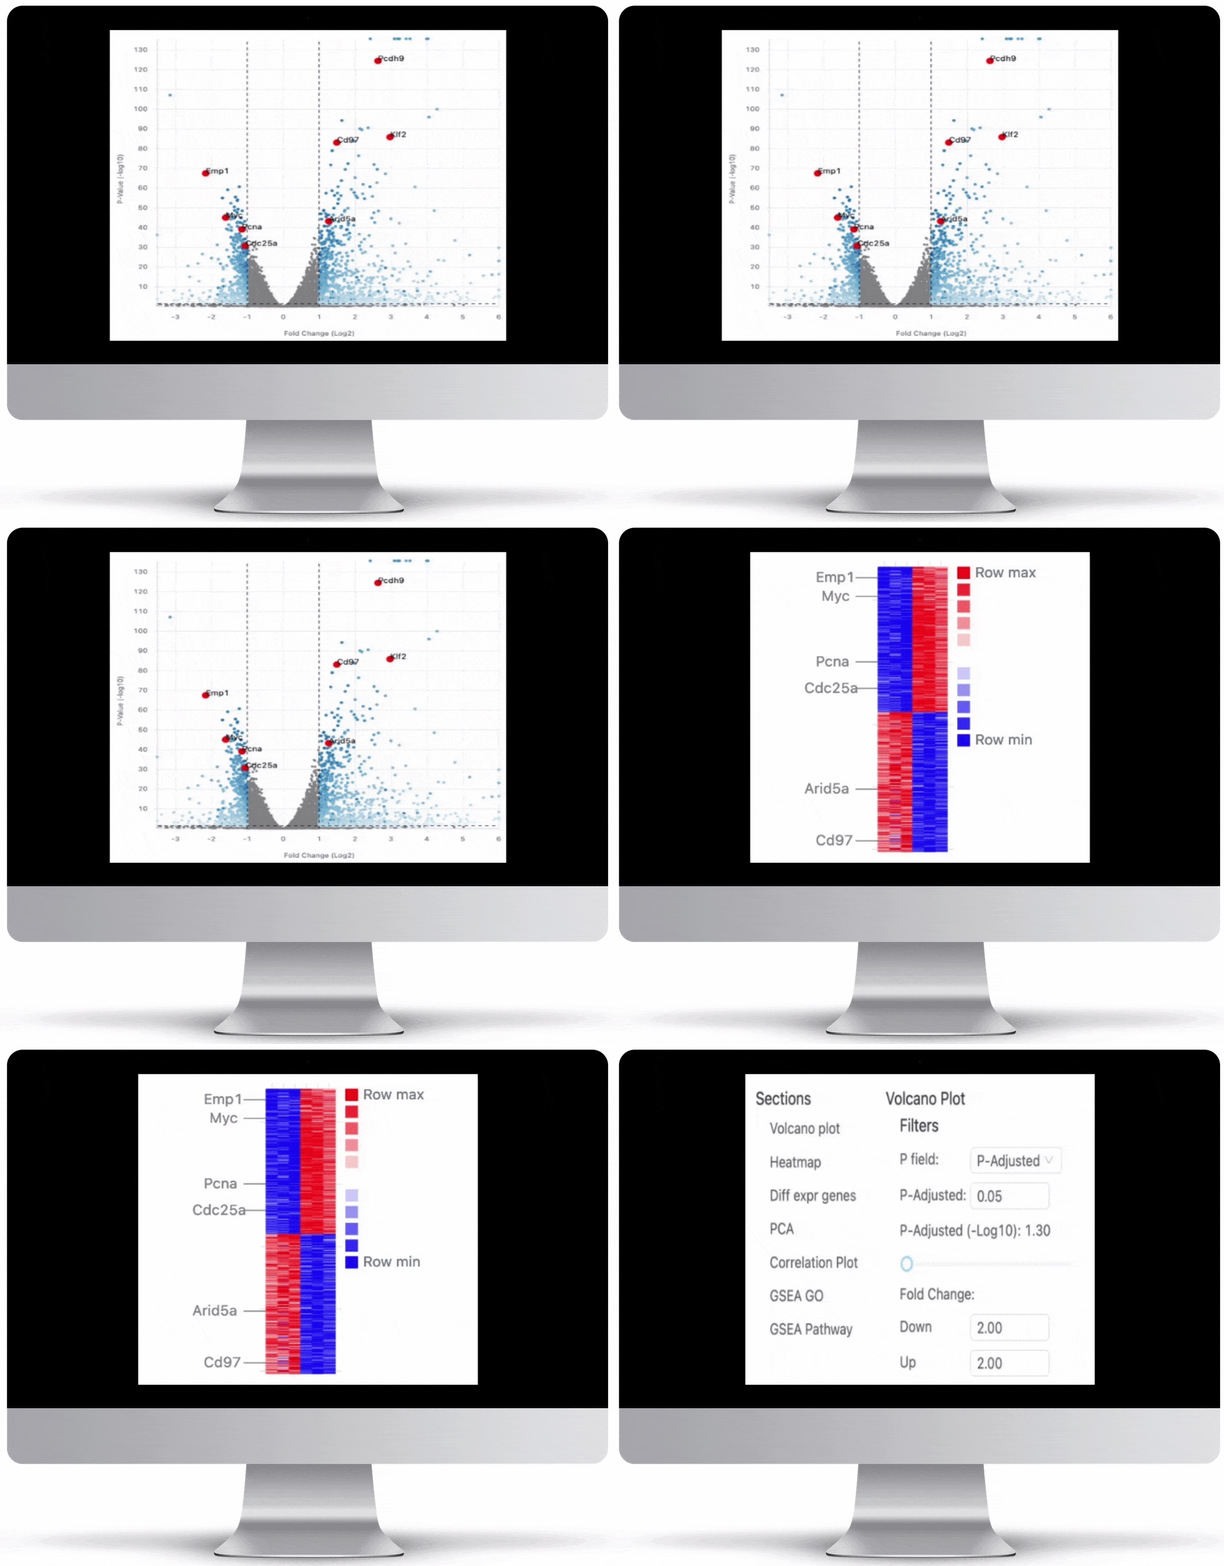
The volcano plot is useful for determining the thresholds for making up-regulated and down-regulated genes. A set of filters and p-value sliders allow you to modify the volcano plot and accompanying heatmap on the fly. You can then download high-res images of both for publication or further downstream analysis.
Gene Set Enrichment
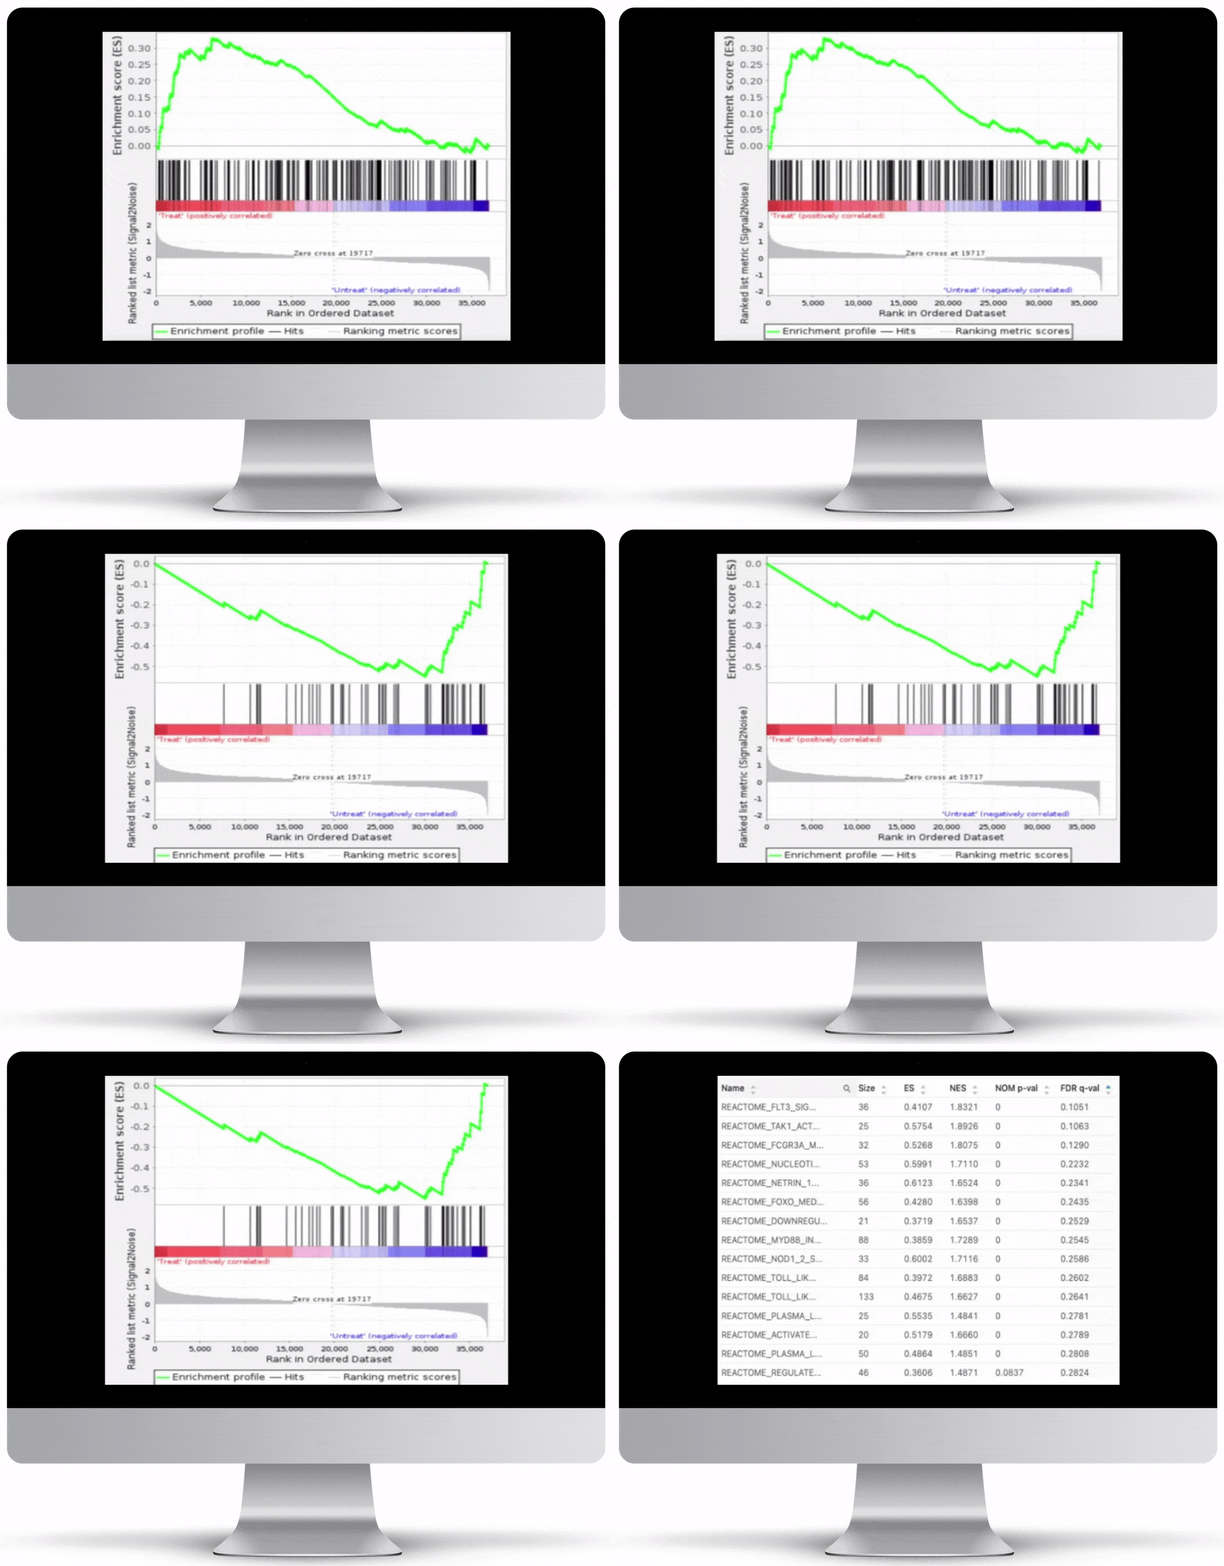
To turn the results of your differential expression analysis into biological insights, we perform gene set enrichment analyses using curated gene ontology and cellular pathway databases.
What about my Bioinformatics team?
Despite our simplified exterior, Basepair is powered by intricate bioinformatics algorithms under the hood. We already support standard analysis pipelines and will collaborate with your bioinformatics team to deploy your custom approved workflows to your new Basepair portal. What’s more, the platform is extensible through our CLI and powerful APIs so that your Bioinformatics team can interact with it in a way that they are more familiar with.

Ready to take your RNA-Seq data analysis to the next level?
Don’t take our word for it, try all of these features for yourself. Inspect finished reports, use sample RNA-Seq data or upload your own with our free, no-commitment 14-day trial, and see why some of the world’s top institutions are using Basepair to save time and money on their NGS data analysis.
Basepair Work is in Dozens of Peer-Reviewed Journals
“Fast, excellent and reasonably priced…you CAN get all three!! Thank you to the folks at Basepair for helping us deal with some difficult RNA Seq data.”
“I really like how easy the website is to use. And how quickly the results are generated, including figures. I would have never thought about doing a new analysis like I just did.”
“Support answers come fast and are always precise!”


