
Background
One of the most popular tools for pathway enrichment analysis for RNA-seq and microarray data is the Gene Set Enrichment Analysis (GSEA) tool by the Broad Institute [1,2]. The database of pathways most often used with GSEA is MSigDB, also by the Broad Institute. MSigDB contains many types of pathways, from curated gene sets (like KEGG) to gene ontology, regulatory motifs, and many one-off signatures defined by the literature. We currently offer basic GSEA analysis using MSigDB as part of our differential expression analysis pipeline, and plan to extend it in the future.
GSEA using MSigDB are great options if the organism you are studying is human, but what if you have a non-human organism? The vast majority of pathways defined in MSigDB are within human context, and the biology of something like yeast is obviously vastly different. However, MSigDB is still used quite frequently for non-human species like mouse. As already mentioned, we do offer GSEA/MSigDB as part of our differential expression analysis pipeline, and we offer it whether your species is human or not. Hence, we wanted to explore the impact of using non-human species has on the statistical power for GSEA/MSigDB.
Results
We used NCBI’s HomoloGene as the source of gene homology information, which contains information for 21 species including human, mouse, yeast, and more. Figure 1 shows the number of genes that have homologs with human per species. Species more closely related to human such as Pan troglodytes (chimpanzee) and Mus musculus (mouse) clearly share more homologous genes with human
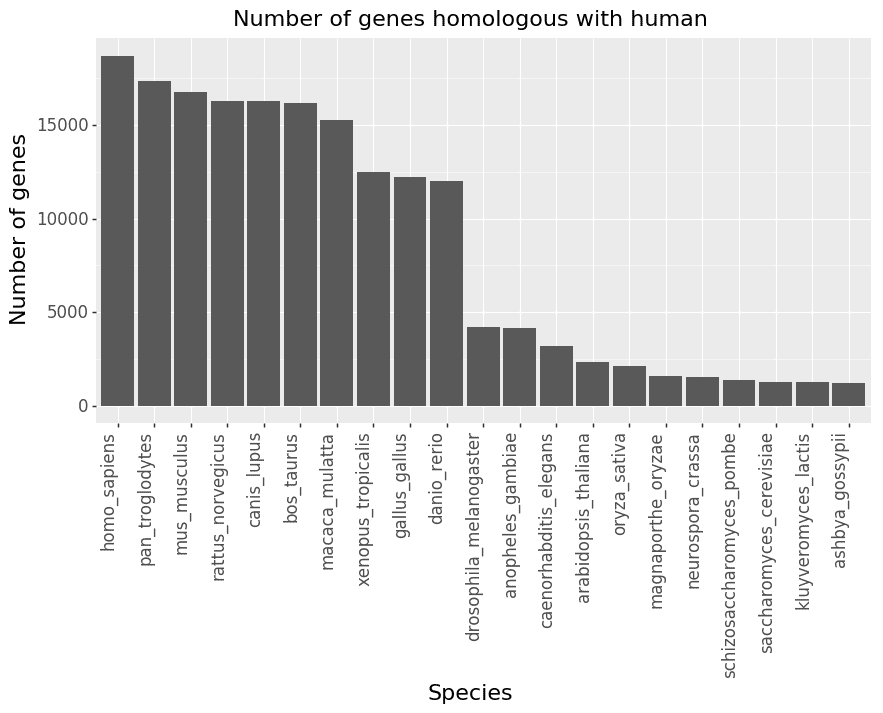
Figure 1: Number of genes in each species that have homologs with human. The number of genes in HomoloGene for human is plotted on the left.
We next investigate the impact of converting the MSigDB pathways (which use human genes) to non-human species. One thing to note is that GSEA has a default option to remove pathways that are too small (less than 15 genes) or too big (more than 500 genes) for statistical reasons. Figure 2 shows the number of pathways left in MSigDB after converting human gene symbols to each species’ gene symbols. Figure 3 shows box plots of the size distribution of pathways for each species.
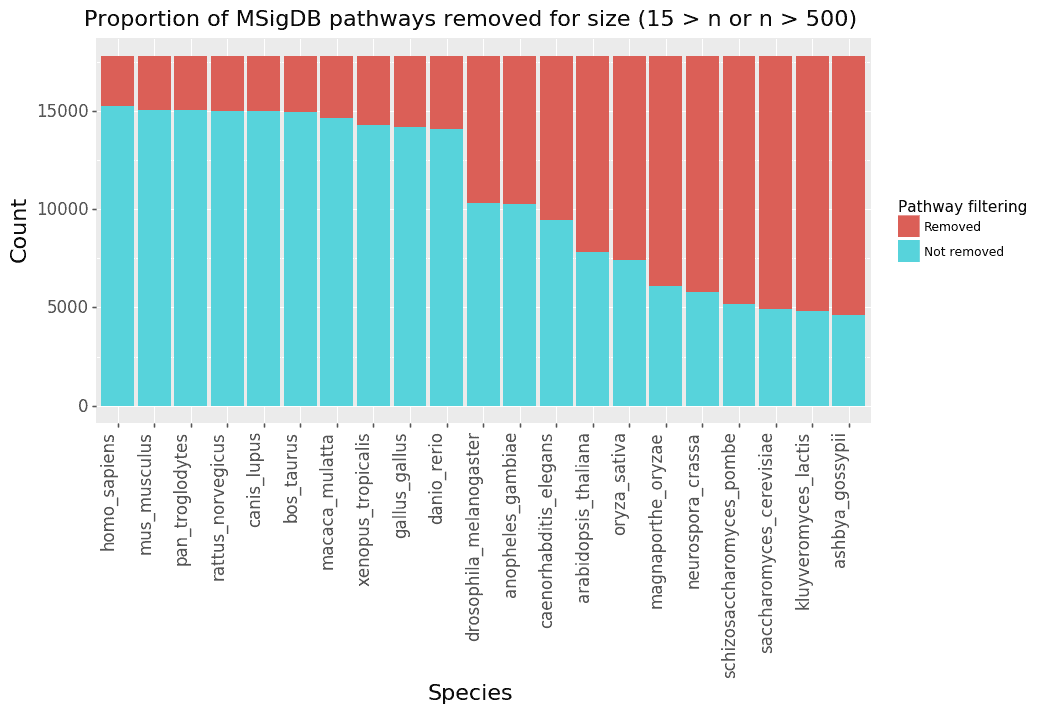
Figure 2: For each species, the genes in the MSigDB pathways are removed if they have no homolog with human. The plot then shows the number of pathways that are removed for being too small (less than 15 genes) or too big (more than 500 genes).
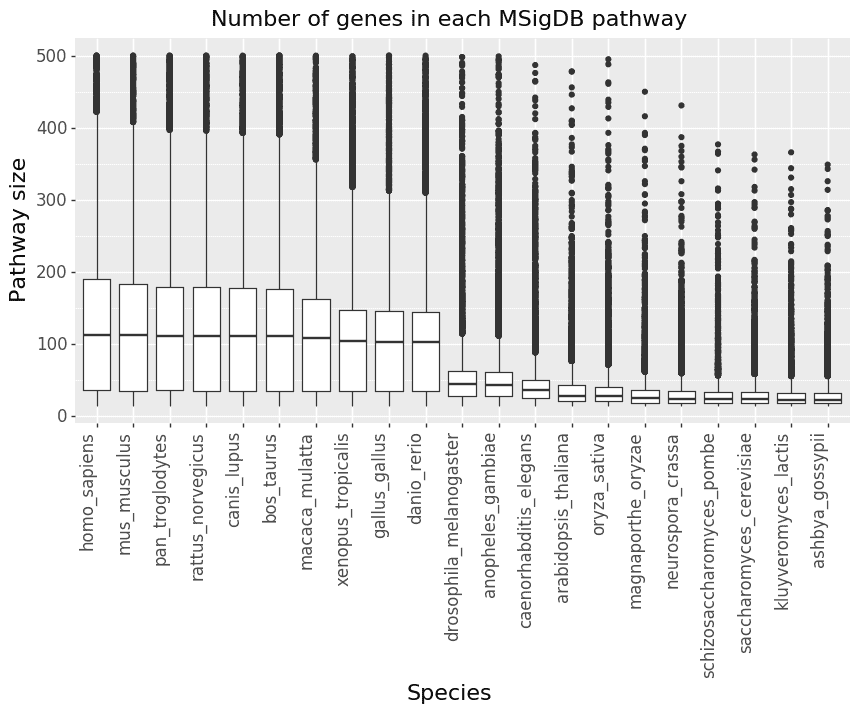
Figure 3: For each species, the genes in the MSigDB pathways are removed if they have no homolog with human. The plot then shows the size distribution of the number of genes in each pathway in MSigDB.
We next assessed the impact on GSEA’s statistical power to detect the enriched pathways when you have non-human species. An ideal way of performing such an experiment would be to have RNA-seq data from the 21 species in HomoloGene where each sample has the same biological processes perturbed, so GSEA results on each species should relatively be the same. However, performing such an experiment would be quite difficult or impossible. For one, the biology represented in many of the MSigDB pathways may not even exist in more distantly related organisms like yeast. However, what we can do is perform GSEA on human RNA-seq data as a sort of “truth dataset”, then for each species, perform the same GSEA (using the same human dataset) but remove genes from MSigDB that have no homology with human. This allows us to determine how well we can identify those same pathways in the “truth dataset” when we remove genes that lack homology between human and other species.
We performed our benchmarking using RNA-seq data from human cancer cell lines [3]. We selected randomly selected 10 samples from each of the six groups:
- Breast, Adenocarcinoma
- Colo-Rectal, Adenocarcinoma
- Lung, Adenocarcinoma
- Brain, Glioma
- Stomach, Carcinoma
- Ovary, Carcinoma
We then performed GSEA comparing “Breast, Adenocarcinoma” against each of the other five groups. Moreover, we performed the five comparisons using the following pathway sets from MSigDB:
- h.all.v6.2.entrez – hallmark gene sets
- c2.all.v6.2.entrez – curated gene sets (e.g. KEGG)
First we perform GSEA using all the genes (as you would do with human samples) to create the “truth” set of pathways. Then for each subsequent species, we remove genes in MSigDB that do not have homology with human before performing GSEA again. Accuracy is the proportion of pathways that are also in the “truth” set. Figure 4 shows the results from our analysis. No surprise, the accuracy go GSEA analysis goes down with more distantly related organisms, but is fine for more closely related ones like mouse and chimpanzee. However, the impact on the “c2.all.v6.2.entrez” pathway set is much smaller.
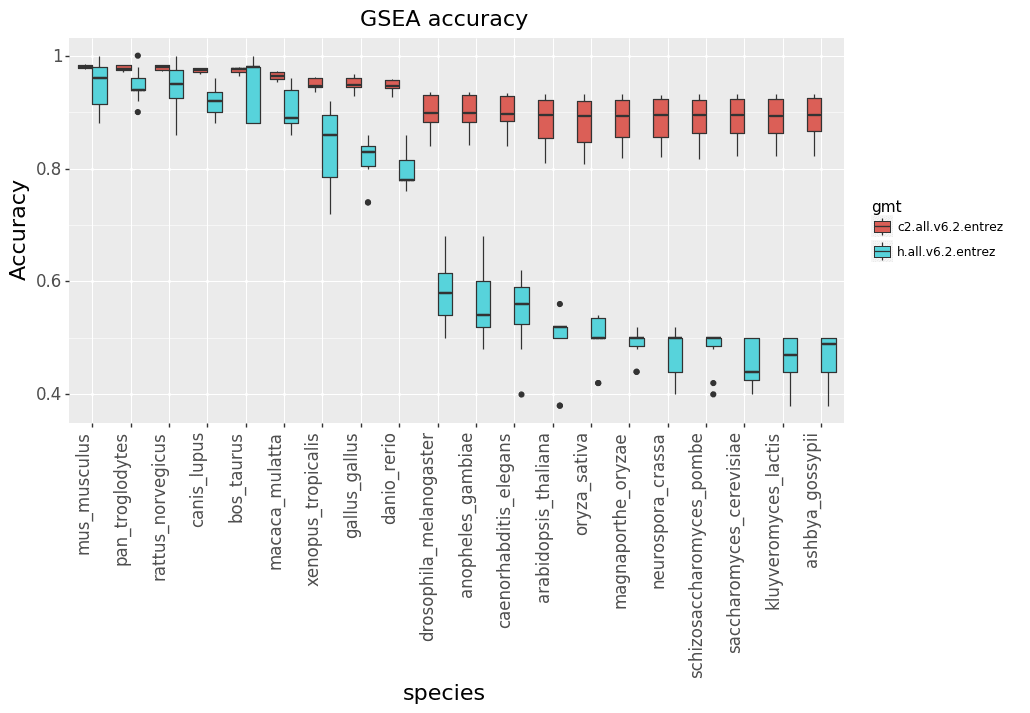
Figure 4: For each species, the genes in the MSigDB pathways are removed if they have no homolog with human. GSEA is then performed with the filtered MSigDB pathways. Accuracy is then computed by comparing results with those achieved when running GSEA with no filtering of genes.
Conclusions
The Broad Institute’s GSEA and MSigDB pathway database are one of the most popular resources for pathway analysis. Most pathway analysis software (including GSEA/MSigDB) are geared toward samples from humans. Here we assessed the impact on converting the human genes in MSigDB to non-human ones. Our key findings are the following:
- Converting human genes in the MSigDB pathways to non-human ones significantly reduces gene set size and number. However, this is less true for more closely species like mouse and chimpanzee.
- Performing GSEA on MSigDB after converting to a non-human species, accuracy is significantly impacted with more distantly related organism.
References
- Zyla J, Marczyk M, Weiner J, Polanska J. Ranking metrics in gene set enrichment analysis: do they matter? BMC Bioinformatics. BioMed Central; 2017 May 12;18(1):256.
- Subramanian A, Tamayo P, Mootha VK, Mukherjee S, Ebert BL, Gillette MA, et al. Gene set enrichment analysis: a knowledge-based approach for interpreting genome-wide expression profiles. Proc Natl Acad Sci USA. 2005 Oct 25;102(43):15545–50.
- Klijn C, Durinck S, Stawiski EW, Haverty PM, Jiang Z, Liu H, et al. A comprehensive transcriptional portrait of human cancer cell lines. Nat Biotechnol. 2015 Mar;33(3):306–12.