
As you may already know, Basepair offers a number of very popular tools for ChIP-seq analysis, seamlessly taking your FASTQ files to meaningful results. From trimming and alignment, peak calling and annotation, to motif enrichment and now, pathway enrichment analysis — all these steps take about an hour to run.
An Overview of Basepair’s ChIP-seq Pipeline
When choosing which tools to offer in our pipelines, we strive to pick the most reliable and highly cited tools. Our bioinformaticians are always reading the latest literature and updating versions regularly to ensure the researchers who use Basepair are using the best available pipelines to get the best possible results from their data.
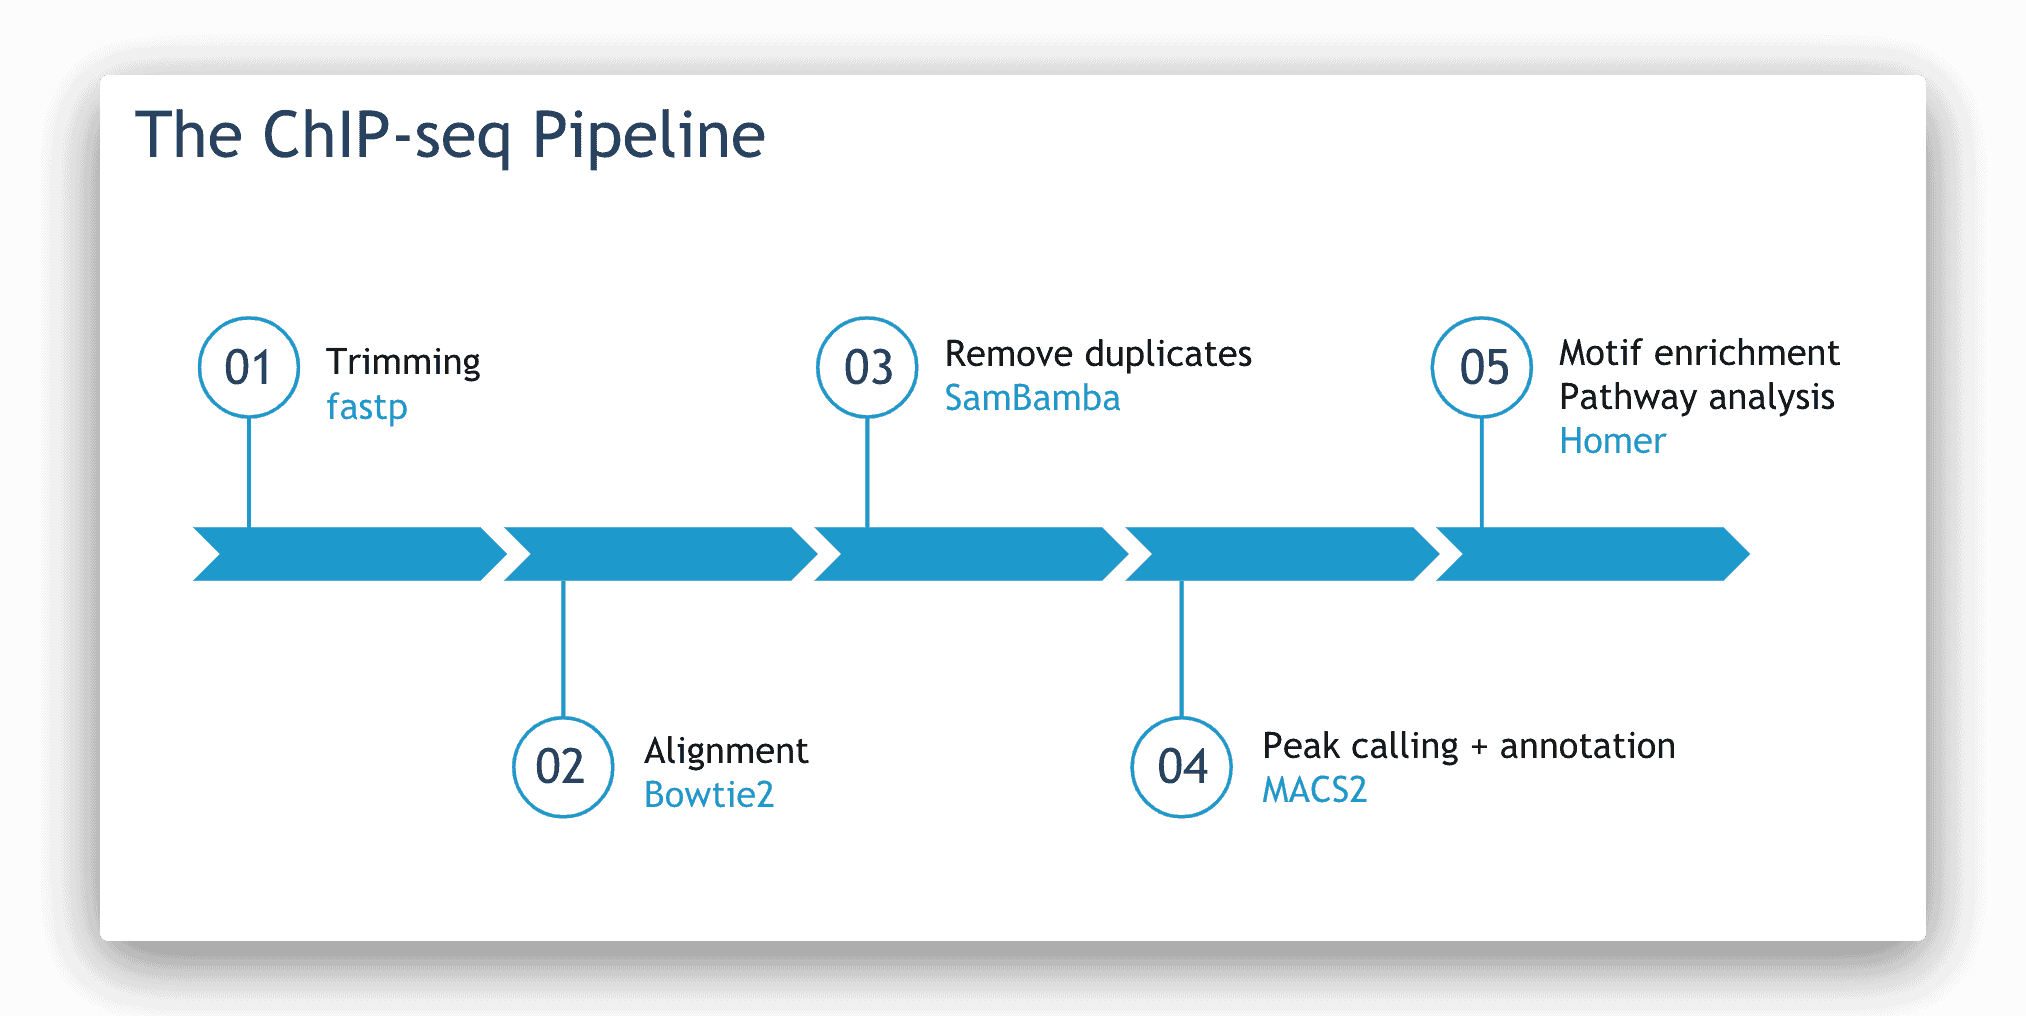
The steps and tools used in Basepair’s ChIP-seq pipelines.
The tools used in our ChIP-seq pipelines are as follows. Trimming and quality control are done using fastp. Then, Bowtie2 is used for alignment. Duplicates are removed using Sambamba. Peaks are called and annotated using MACS1.4 or MACS2. Finally, HOMER is used for motif enrichment and pathway enrichment analysis.
Pathway Enrichment Analysis for ChIP-seq Data
Basepair uses HOMER’s findGO tool to perform the enrichment analysis. It is a very popular tool that uses over 20 ontologies and gene sets from popular databases like Gene Ontology, MSigDB, and others to check for enrichment.
The data is displayed in an interactive table. Click on the filter icon next to the Database column to filter and display pathways of specific databases.
Quickly select and filter pathways from over a dozen databases.
Other sections of the ChIP-seq report
In addition to the newly-released enrichment table, the ChIP-seq report on Basepair includes plenty of other interactive figures and tables.
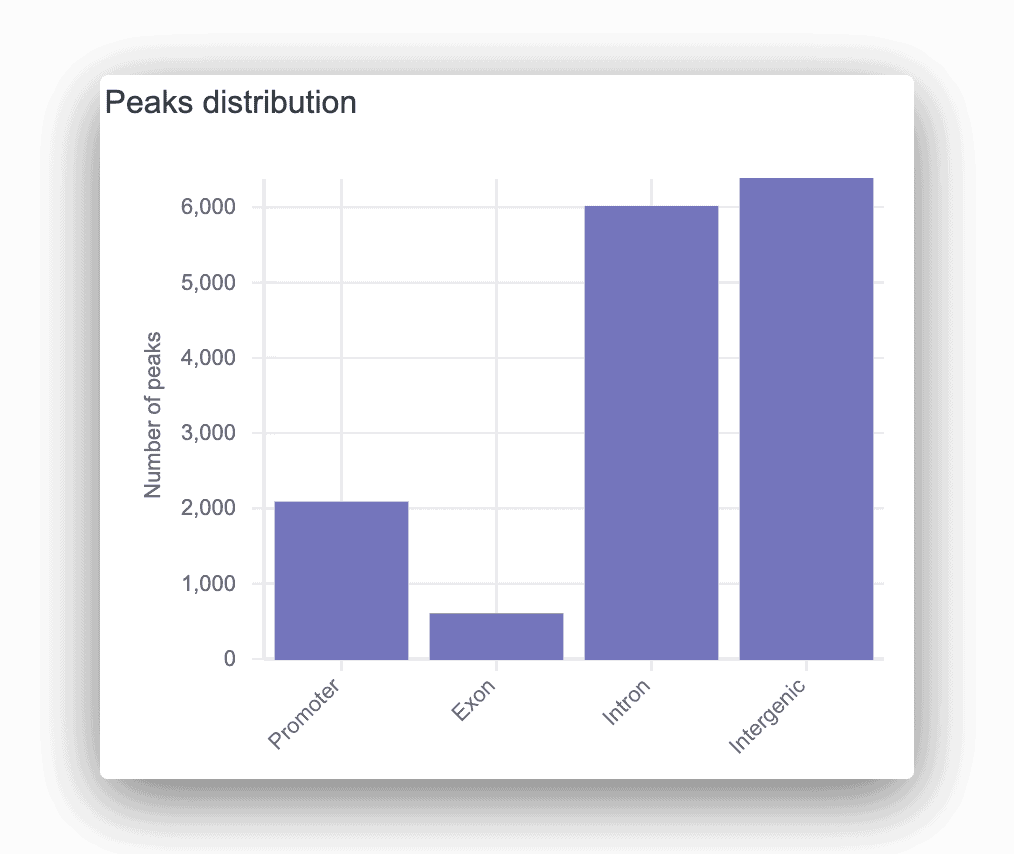
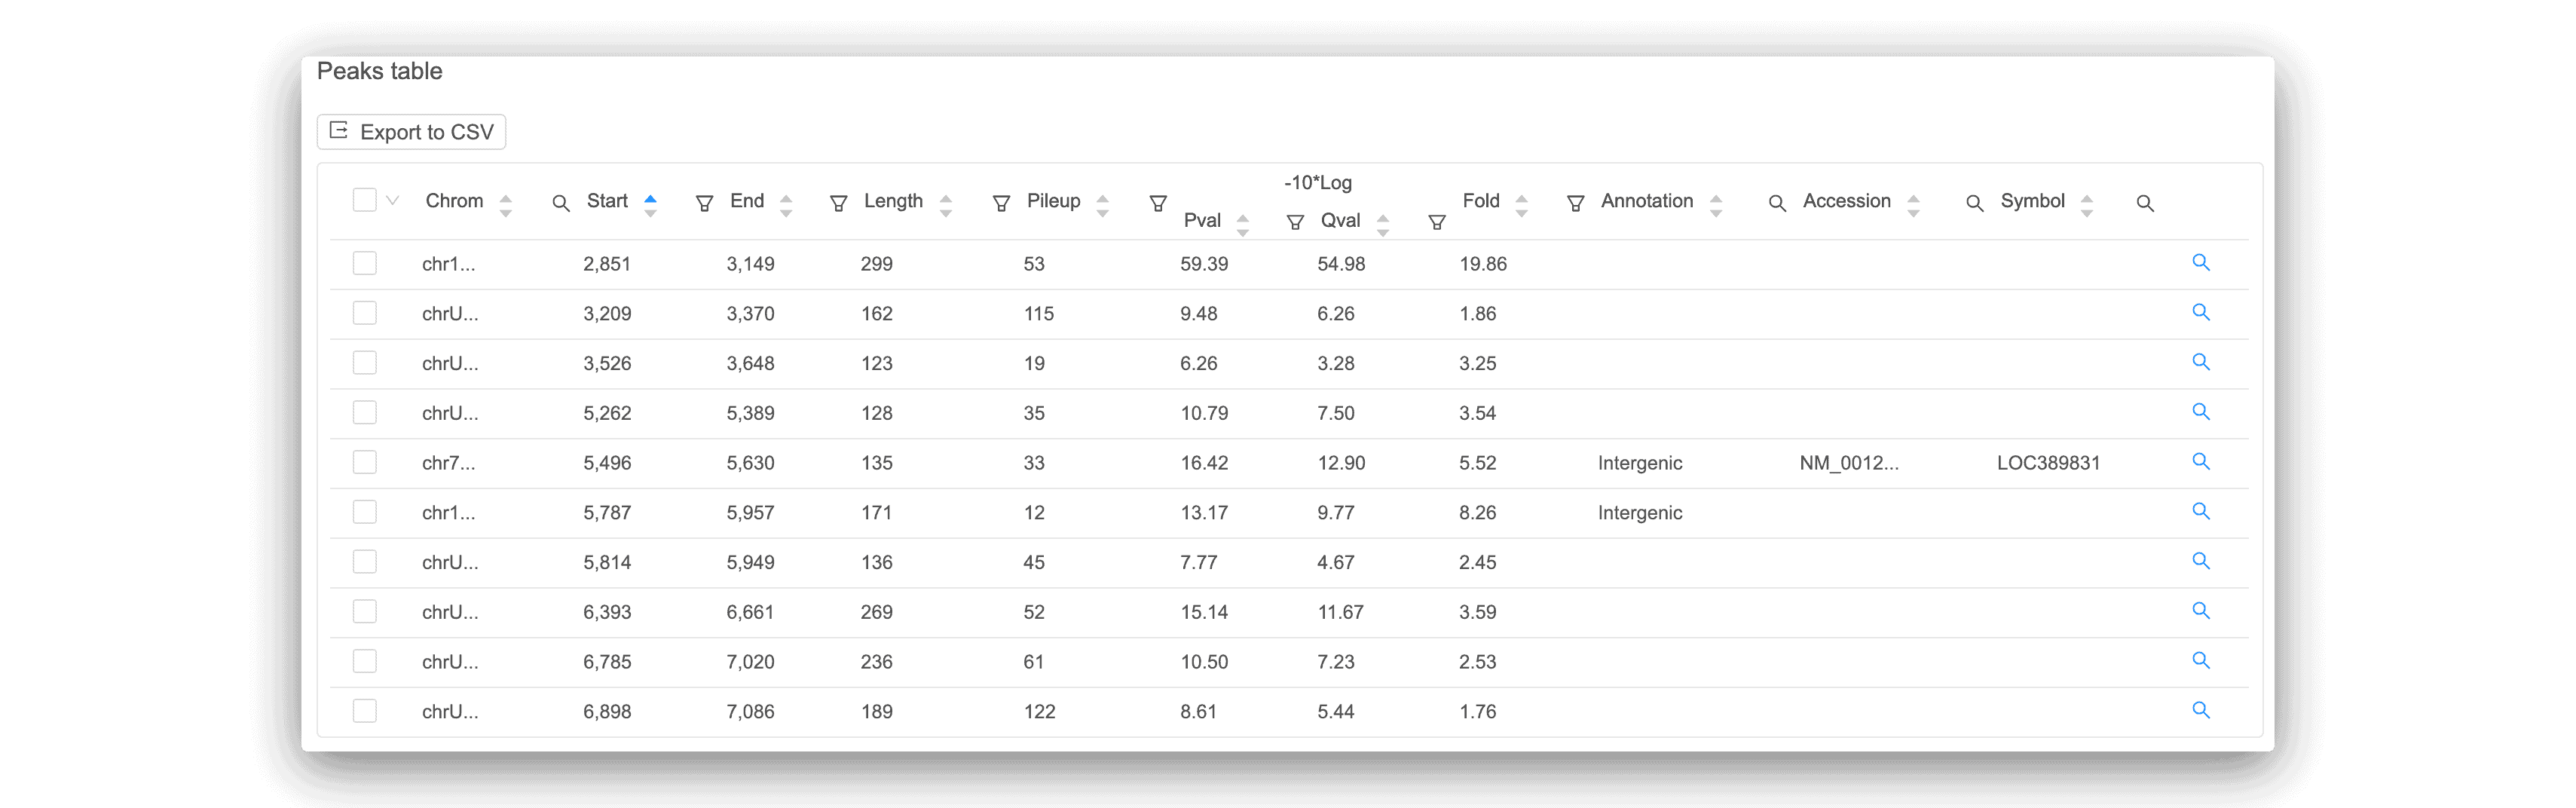
The peaks distribution graph and peak calling table can help you easily identify signal peaks in your data. Each peak is annotated as promoter, intronic, or intergenic, with the corresponding gene displayed. For any peaks found, a motif analysis is done to find overrepresented transcription factor binding sites.
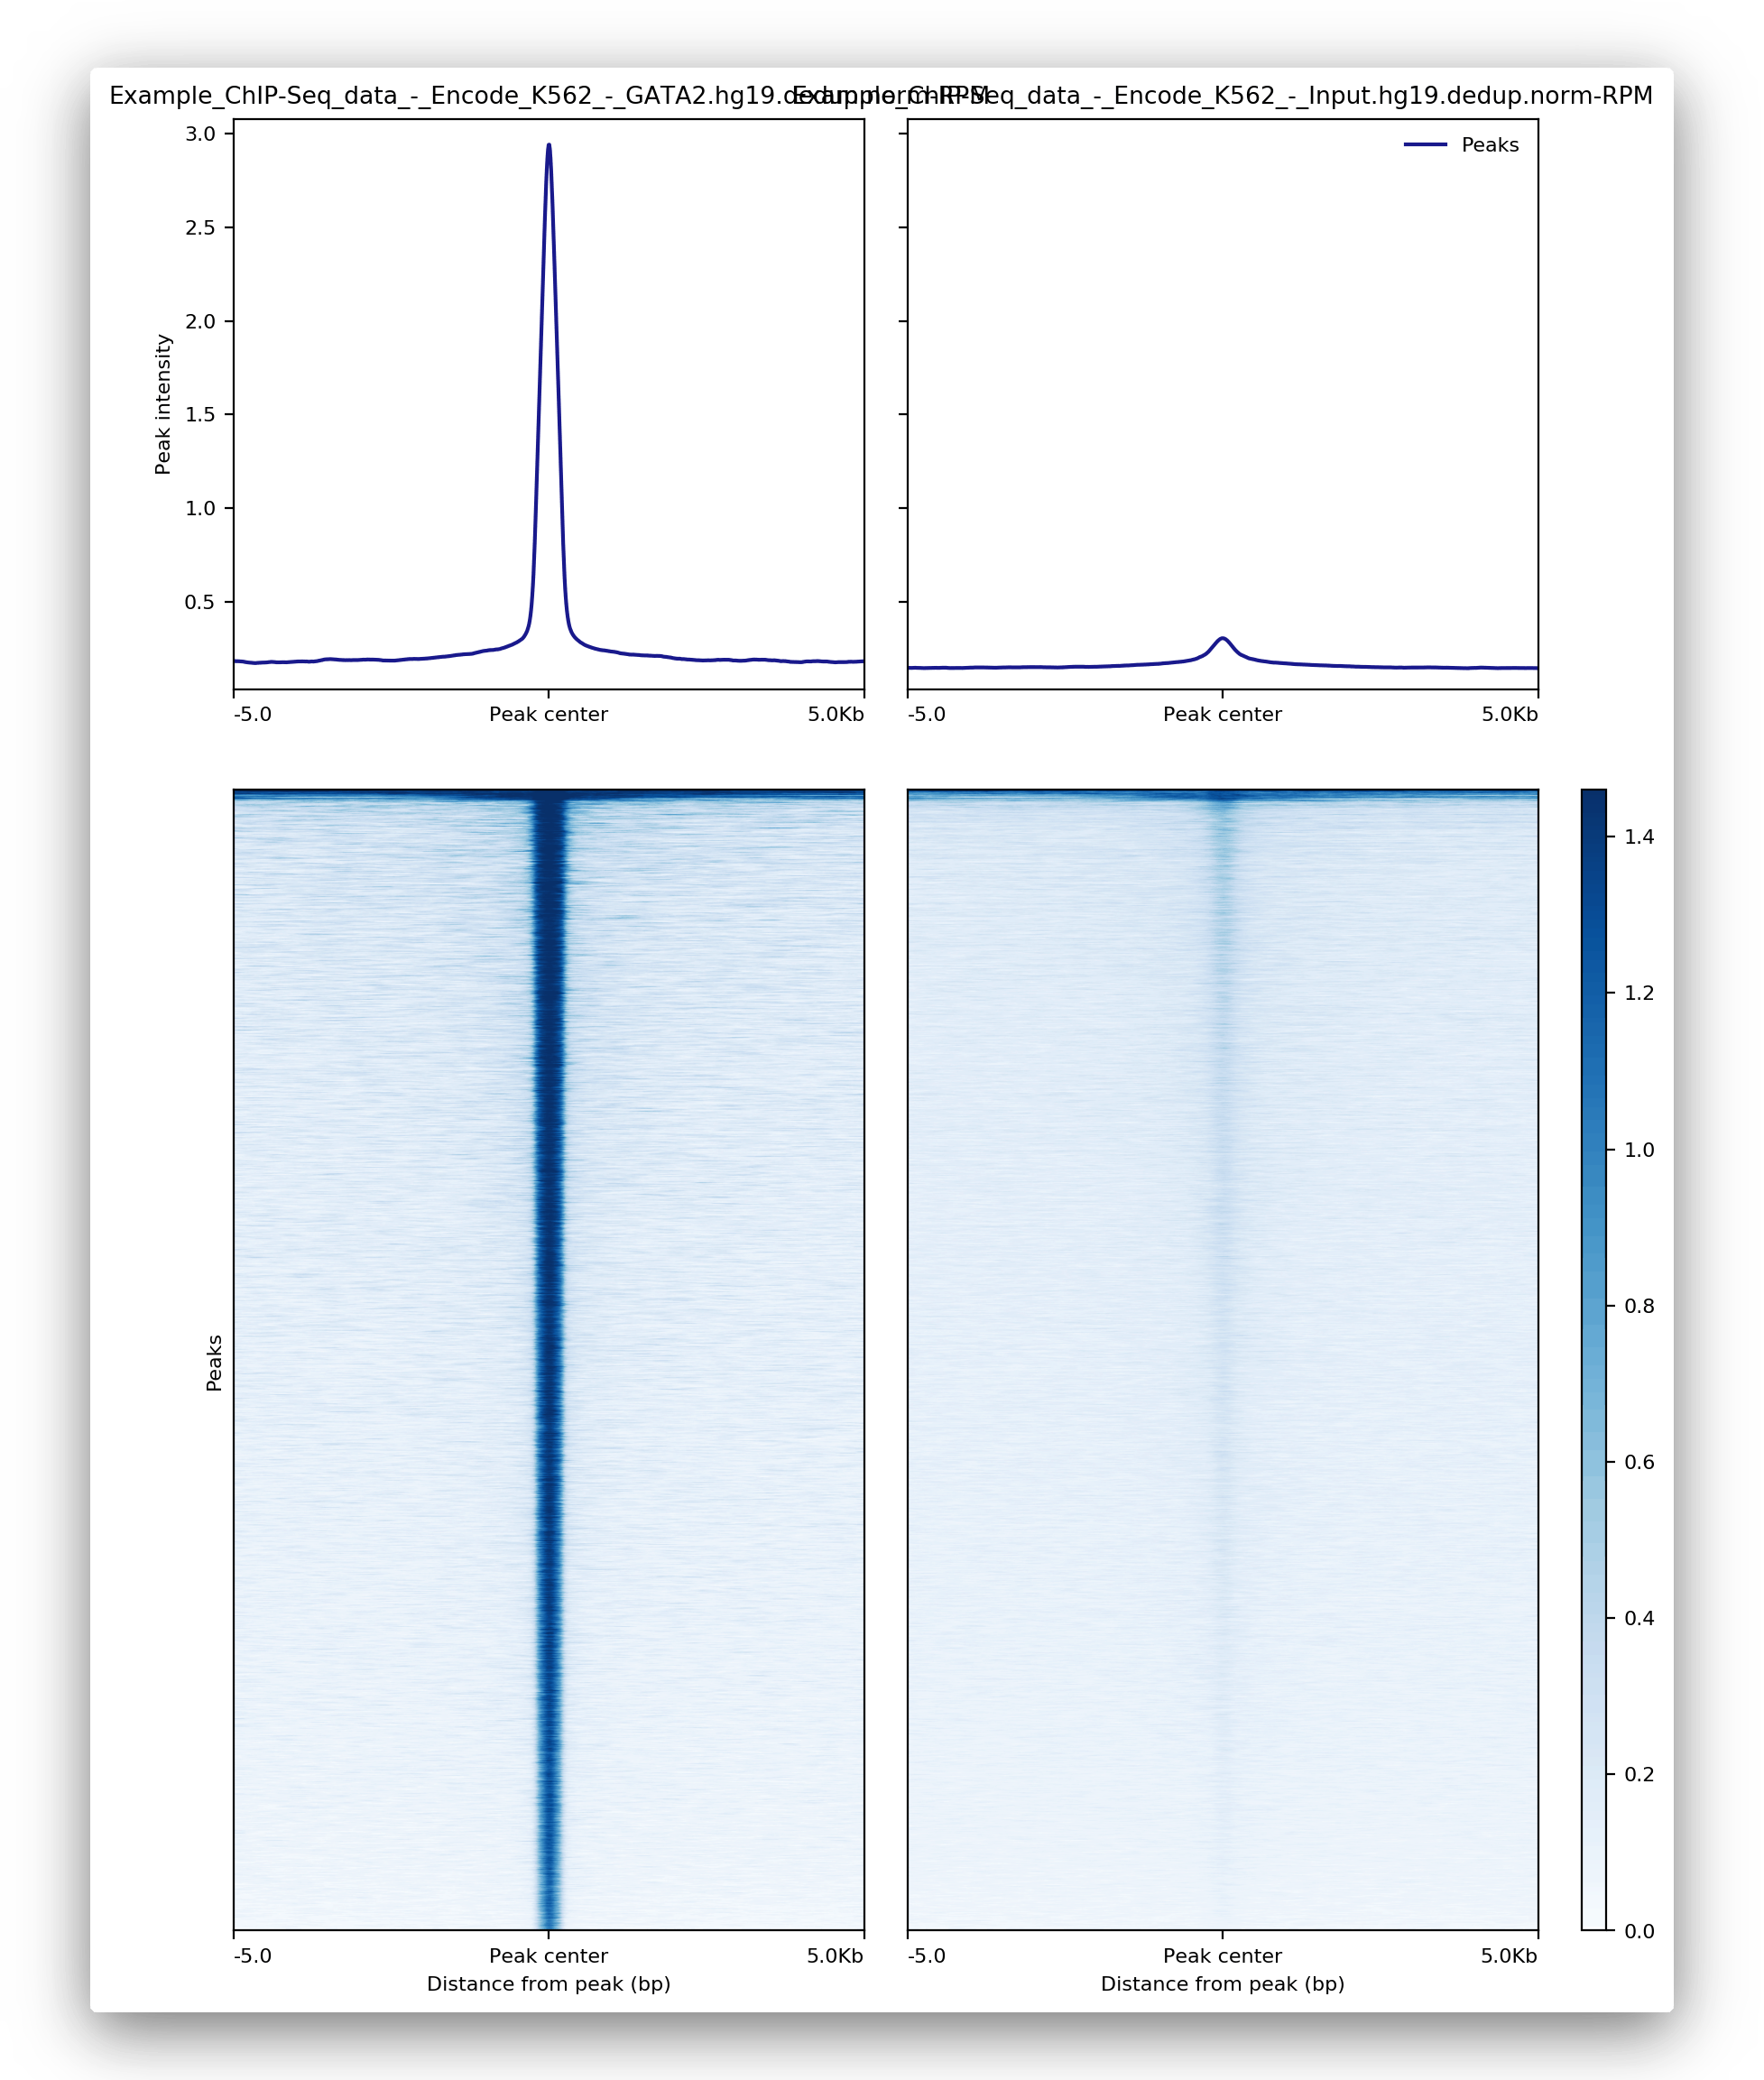
The gene body and transcription start site figures and corresponding heatmaps help you locate the appropriate signals. This ensures your sample has the expected pattern for the selected ChIP. If the signal-to-noise ratio is low, these figures can help you quickly identify any issues.
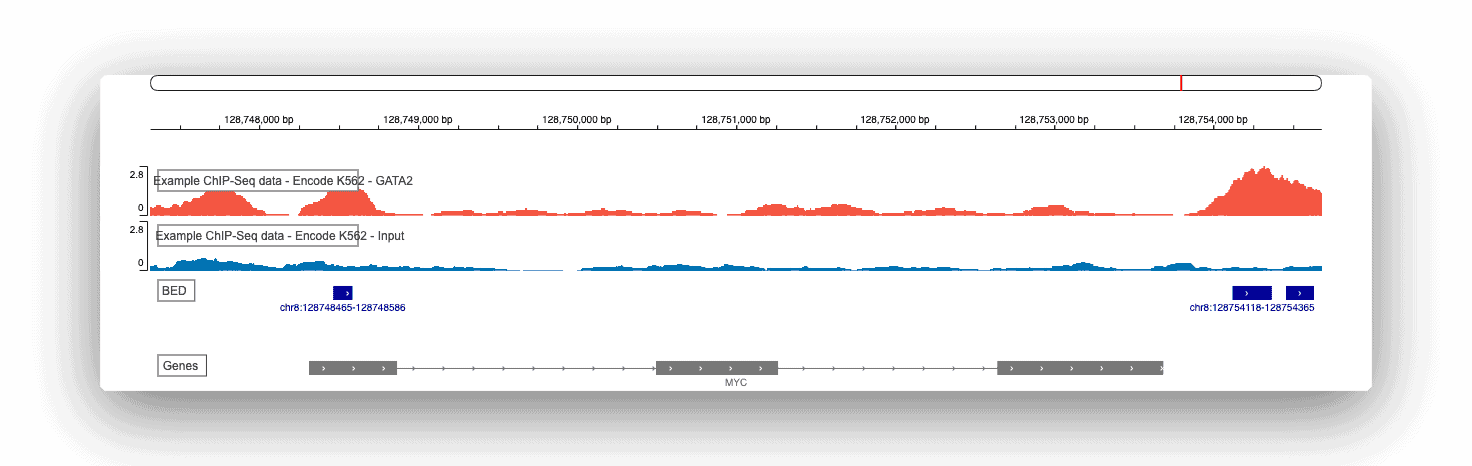
The genome browser is included at the end of every ChIP-seq report and is an important tool that provides you with a visual overview of your raw genomic data. You can zoom in, zoom out, and search for specific genes or loci.
Analyze Your ChIP-Seq Data Now and Get Results in 30 minutes
On average, Basepair’s ChIP-seq pipelines run in just 30 minutes. Hundreds of researchers from top US universities and hospitals already use Basepair to speed up their epigenetic research and publish results faster.
If you’re ready to try this pipeline for yourself and already have ChIP-seq data, sign up for a free trial to start analyzing your data immediately. You can upload 6 samples for free and for a limited time additional samples are only $40 each, including unlimited analyses per sample and 12 months storage. If you don’t have data ready, you can still create an account and view the example ChIP-seq reports that are already on Basepair.
Happy Basepairing!