
A Gentle Introduction to RNA-Seq Analysis
Charlie Murphy, Ph.D
Last Updated: Nov 4, 2020
RNA-seq is a technology that examines the whole transcriptome at unprecedented levels of sensitivity. There are a wide range of applications for RNA-seq, from expression quantification, discovery of novel genes and gene isoforms, differential expression, and many other types of functional analysis [1]. Hence, researchers can use RNA-seq to answer many of their most compelling questions. It can find new cancer subtypes, discover the transcriptome of never-before-sequenced species, elucidate tissue-specific gene expression, and many other applications. Due to this dizzying array of RNA-seq applications, we want to provide a gentle introduction on the major steps in analyzing RNA-seq data:
- Quality control and trimming
- Read alignment
- Quantify expression
- Differential expression
Quality control and trimming
As the first step, low quality reads and adaptor sequences need to be removed from the data (a step called trimming). Adaptors are short sequences used to prepare your sample for sequencing and need to be removed before analysis. On Basepair, the impact of trimming on read quality is commonly shown in figures like Figure 1. But how is quality measured? Sequencing machines will output a quality score for each base pair sequenced (called a Q value). Higher Q values mean better data. Trimming is important because it removes the poor quality parts of the read, or even the entire read if necessary. This increases the amount of useful data for downstream analyses. For a more detailed overview of how trimming impacts data quality, read our blog post on the subject.
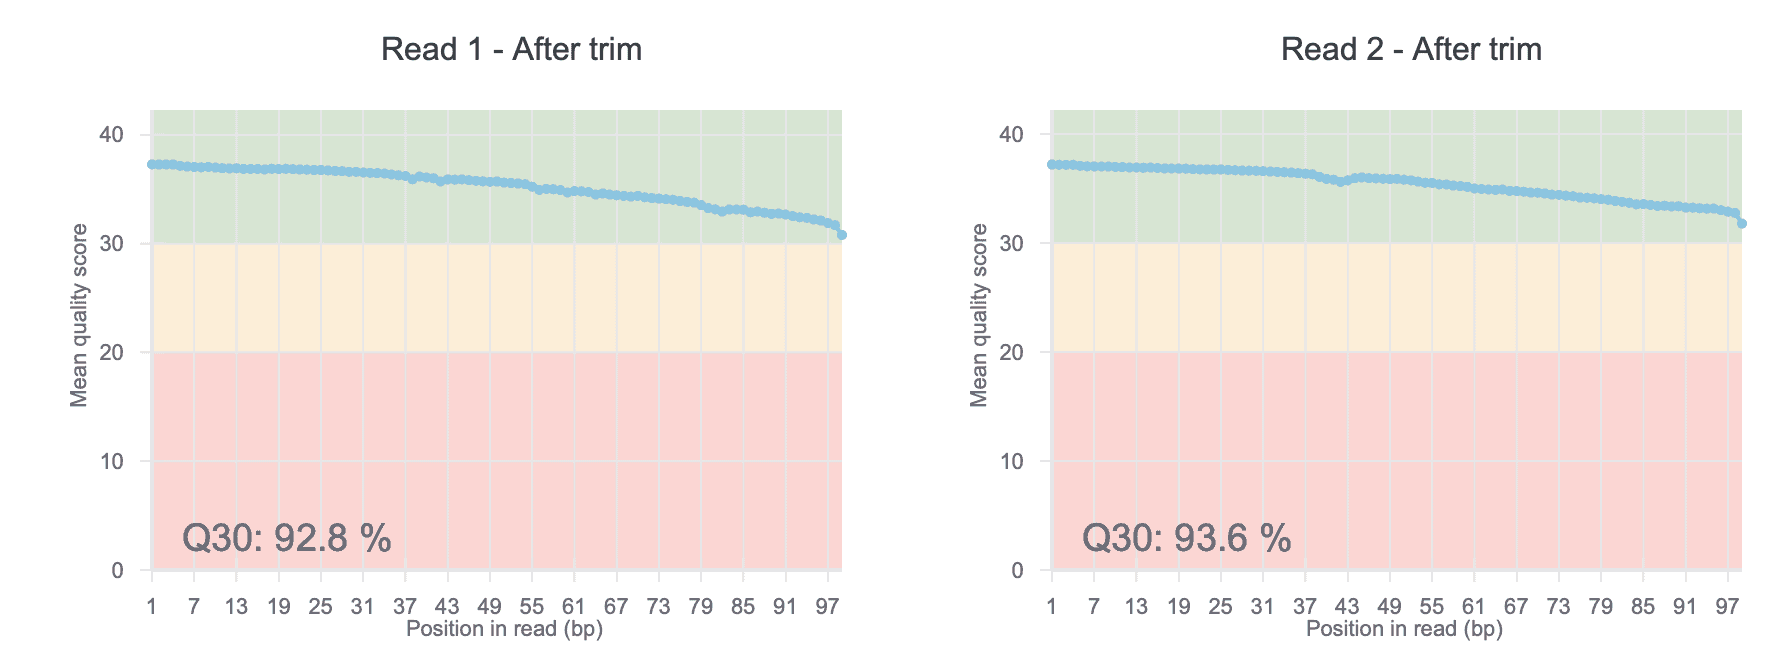
Figure 1: Representative plot from Basepair showing the mean quality scores for each position in the read after trimming. “Q30” means the percentage of bases in all reads with quality score of 30 or greater.
Read Alignment
After trimming, reads are typically aligned to either a reference genome or transcriptome. Alignment is the algorithm to figure out which gene a read came from. Basepair provides the popular STAR and TopHat tools [2,3]. Another option if your species has no reference is to assemble your own transcriptome using Trinity, which is also offered on Basepair [4].
There are several metrics to pay attention to after alignment is finished. Ideally, reads align uniquely to one place in the genome, and you generally want to see >70% uniquely aligned reads. However, some reads may align to multiple locations, so it is unclear which gene the read came from, and are removed. Alignment outputs data in the SAM format (Sequence Alignment Map), which is then converted to the compressed format (BAM) and used for further downstream analyses. Basepair visualizes the read processing steps from the total starting reads, how many were trimmed, to how many aligned (Figure 2).
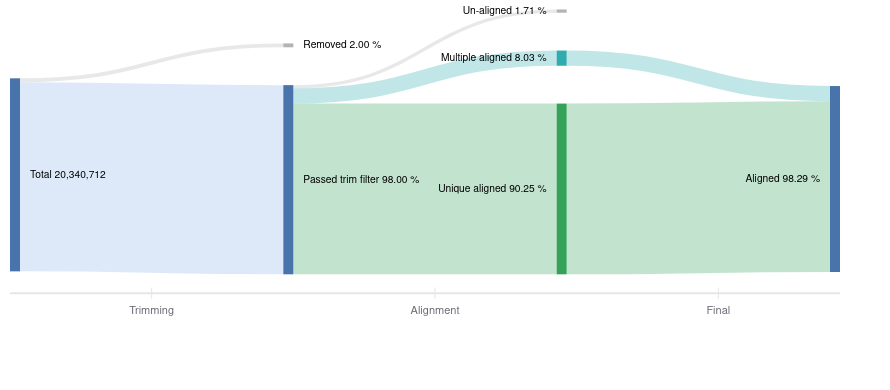

Figure 2: Representative Sankey plot from Basepair showing the amount of reads you have starting from raw data to trimming and alignment.
Expression Quantification
The next step is to quantify gene expression. The number of reads that align to each gene is quantified using programs such as HTSeq-count or featureCounts. However, raw read counts are not appropriate to compare expression between samples and genes. Raw read counts do not account for biases such as gene length and total number of reads in each sample. The measure FPKM (Fragments Per Kilobase of exon model per Million mapped reads) is a common within-sample normalization method [2]. Basepair RNA-seq analysis pipelines provide expression in raw counts, FPKM, and another common normalization method, TPM (Figure 3).
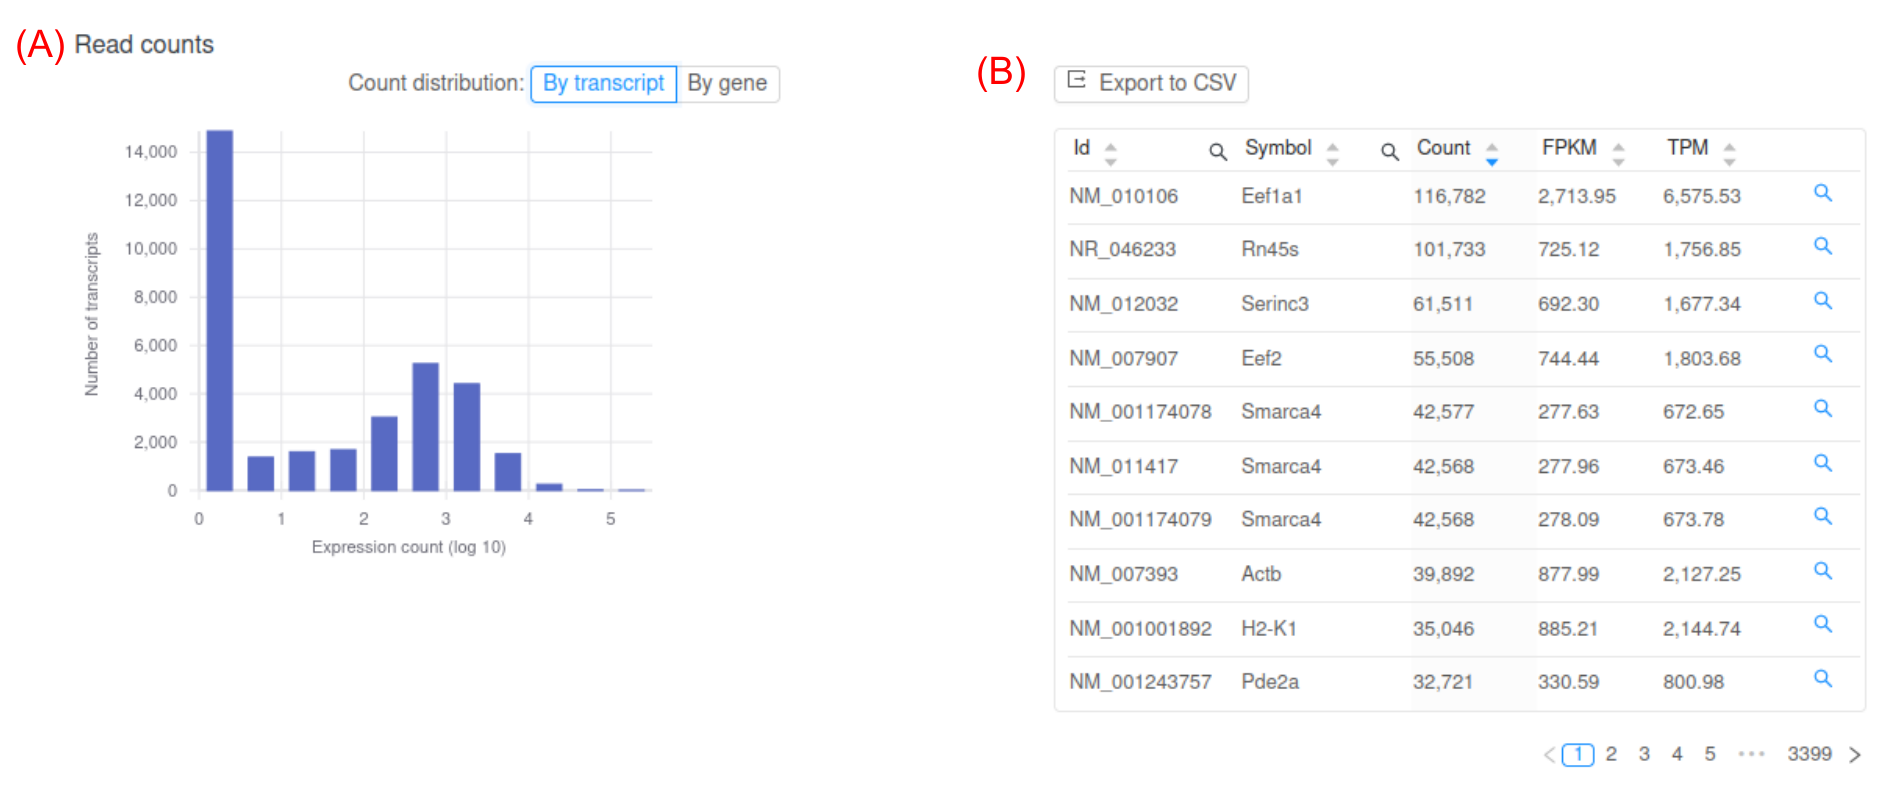
Figure 3: Representative screenshot of the figure and table Basepair provides. (A) histogram of log transformed FPKM values. At the top there is a button that lets you toggle between gene or transcript expression. (B) Interactive table of per-gene expression values, which you can sort and search.
Differential Expression
Another popular analysis for RNA-seq data is differential expression, which statistically tests for gene expression changes between two groups of samples. For example, this can help you find genes that change between treatment and control conditions. Basepair uses the highly cited DESeq2 tool for performing differential expression, which takes as input the raw read counts per gene and outputs log2 fold changes, p-values, and adjusted p-values (among other statistics) [5]. The log2 fold change will tell you the magnitude of gene expression change, while the p-value and adjusted p-value assess the statistical significance. Compared to the p-value, the adjusted p-values is the better metric to look at since it is less likely to produce false positives.
Basepair lets you interactively explore your differential expression results (Figure 4). Moreover, if you need a more complex analysis setup, Basepair can likely still help! In addition to comparing two groups, Basepair can accommodate more complex experimental setups like comparing three or more groups, time course, and nested conditions.
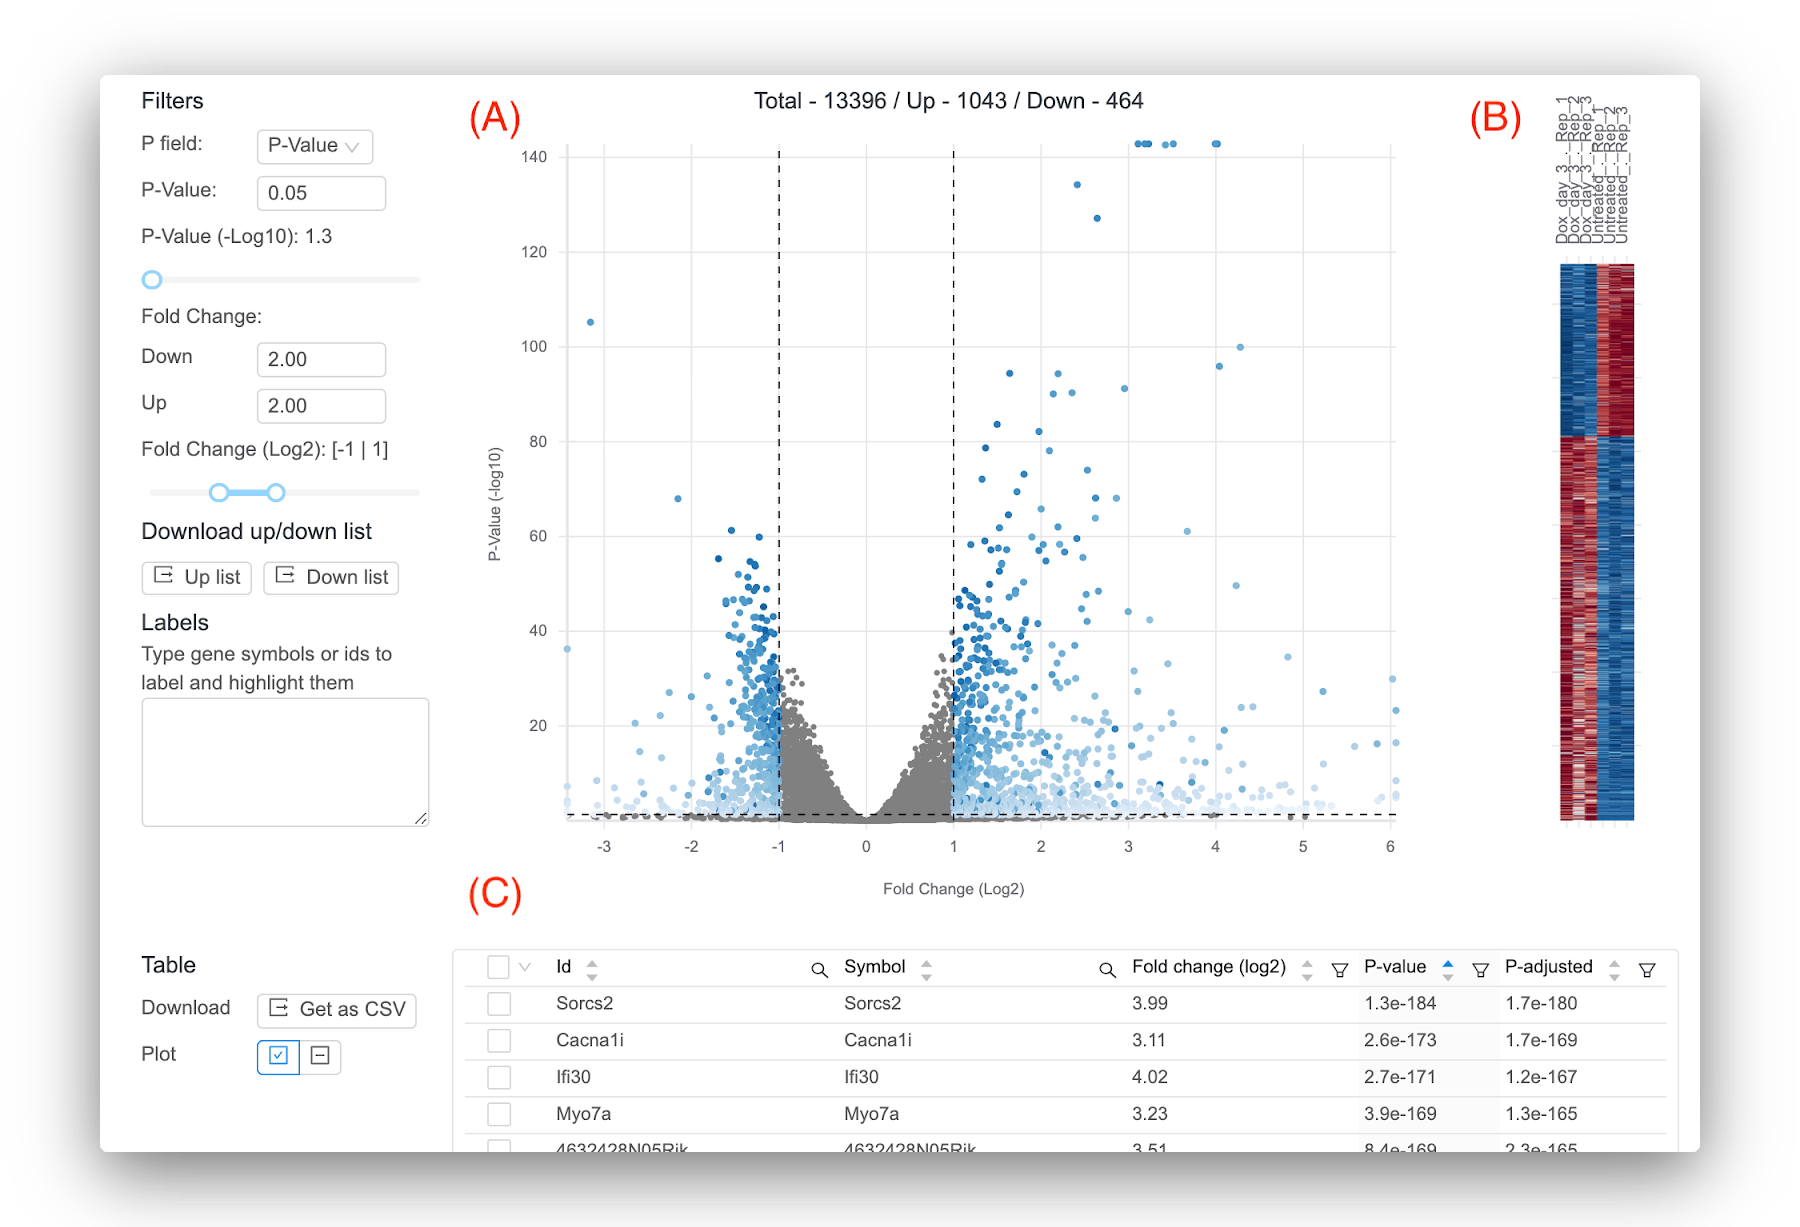
Figure 4: Representative results provided by Basepair. (A) Volcano plot that plots for each gene the -log10(p-value) against the log2 fold change. Significant genes are shown in blue. You can set the thresholds that determine significance using the controls to the left. (B) Heatmap that shows the expression across the samples for the significant genes. (C) Interactive table showing the per-gene values of log2 fold change, p-value, and adjusted p-value. You can sort and filter the columns as well as search for your favorite gene.
Learn more about differential expression in our next article, A Deep Dive Into Differential Expression.
References
1. Wang Z, Gerstein M, Snyder M. RNA-Seq: a revolutionary tool for transcriptomics. Nature Publishing Group. 2009 Jan;10(1):57–63.
2. Dobin A, Davis CA, Schlesinger F, Drenkow J, Zaleski C, Jha S, et al. STAR: ultrafast universal RNA-seq aligner. Bioinformatics. 2013 Jan 1;29(1):15–21.
3. Trapnell C, Pachter L, Salzberg SL. TopHat: discovering splice junctions with RNA-Seq. Bioinformatics. Oxford University Press; 2009 May 1;25(9):1105–11.
4. Haas BJ, Papanicolaou A, Yassour M, Grabherr M, Blood PD, Bowden J, et al. De novo transcript sequence reconstruction from RNA-seq using the 5. Trinity platform for reference generation and analysis. Nat Protoc. Nature Publishing Group; 2013 Aug;8(8):1494–512.
5. Love MI, Huber W, Anders S. Moderated estimation of fold change and dispersion for RNA-seq data with DESeq2. Genome Biol. BioMed Central Ltd; 2014;15(12):550.