
A Deep Dive Into Differential Expression
Charles Murphy, Ph.D
Last Updated: Nov 5, 2020
The function of a cell is largely determined by what genes are active. Therefore, finding differentially expressed genes between conditions is often a necessary part of understanding the molecular mechanisms of phenotypic changes between diseased and normal tissue, or untreated versus treated samples [1]. RNA-seq provides a quantitative read-out of the transcriptional state of cells. From raw count data, statistically significant differences between groups of samples can be determined in an analysis commonly called differential expression. Basepair provides several pipelines to let you perform such an analysis, and this post will go into detail about setting up the analysis and interpreting the results.
Analysis Setup
Before you run a differential expression analysis, you must analyze your samples through the “Expression count (STAR)” pipeline. There are many different published tools for differential expression analysis, but Basepair uses the highly cited DESeq2 tool [1, 2].
The next step is to consider your experimental design. In the simplest setup, you have two groups of samples that you want to compare. However, Basepair can accommodate more complex designs such as: (1) comparing 3+ groups to get the unique genes in each group or run an ANOVA analysis, (2) time course experiments, and (3) nested conditions. ANOVA allows you to compare 3+ groups of samples and get one p-value (for each gene) indicating the significance of a difference between any of the groups. Keep in mind that although the pipeline can accommodate one sample in each group, ideally you should have at least three samples per group.
There are a few other parameters to consider before running your analysis. If you added a spike-in to your sample, you can have the analysis use it to normalize the samples to improve your results. Spike-ins are short, known sequences added to a sample in a specified quantity to enable more accurate expression quantification. Another option to consider is whether you want to perform differential expression on genes or transcripts.
Once you’ve made your parameter selections, you’re ready to start your analysis! The next section will then guide you on interpreting your analysis results.
Interpreting Your Results
Basepair provides several interactive tables and figures so you can explore your results and quickly get answers. Figure 1 shows the main results from running differential expression: the volcano plot, heatmap, and a table containing per-gene statistics like log2 fold change, p-value, and adjusted p-value. By default, the significant genes displayed in the figures are defined using a p-value of 0.05 and +/- 1 for log2 fold change, but you are free to select your own thresholds. However, one piece of advice for defining significant genes is to focus on the adjusted p-value, which is less likely to give you false positive results compared to using the p-value. While there is no true “best” value for the adjusted p-value threshold, commonly used values are 0.01 or 0.05.
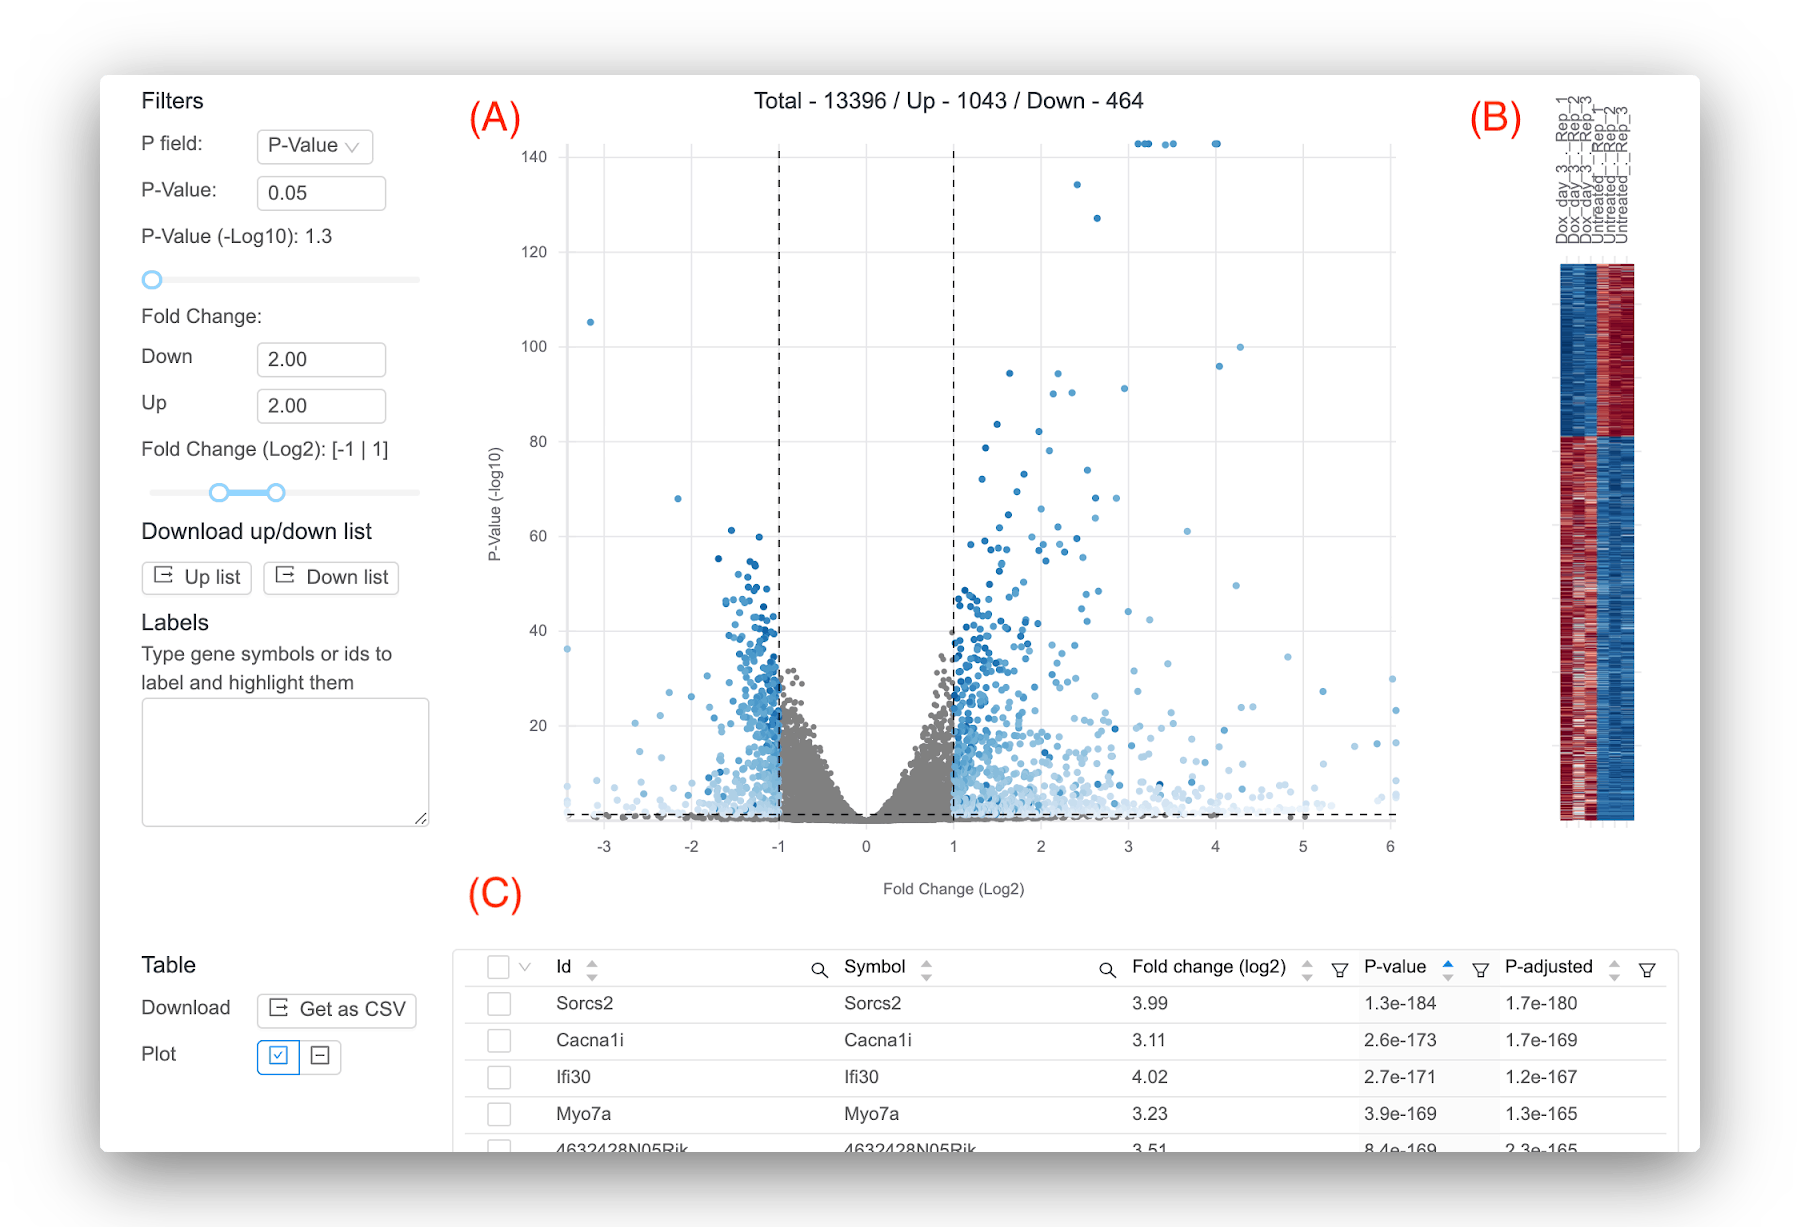
Figure 1: Representative results provided by Basepair. (A) Volcano plot that plots for each gene the -log10(p-value) against the log2 fold change. Significant genes are shown in blue. You can set the thresholds that determine significance using the controls to the left. (B) Heatmap that shows the expression across the samples for the significant genes. (C) Interactive table showing the per-gene values of log2 fold change, p-value, and adjusted p-value. You can sort and filter the columns as well as search for your favorite gene.
Secondary Analysis
Basepair also provides a couple secondary analyses in addition to differential expression (Figure 2). One is a principal component analysis (PCA), which is a dimensionality reduction algorithm to show how the samples group together. PCA uses all expressed genes for its analysis and can aid you in multiple ways: (1) it can help reveal if your samples are clustering as you might expect, (2) reveal if any of your samples are mislabeled, or (3) reveal if there are any outliers. One great thing about Basepair is if you find such problems in your results, you can simply run another analysis while accounting for these issues. You can remove outliers and you can relabel any samples, since not doing so can skew your results and give you much fewer significant genes.
The other analysis Basepair provides is pathway analysis. This is a great tool to get a more granular view into the biological changes occurring in your samples. Basepair uses the widely-used Gene Set Enrichment Analysis (GSEA) tool [3]. GSEA uses a database of gene sets (e.g. KEGG pathways) and performs a statistical test to see if genes within a gene set are more likely to be up- or down-regulated than expected by random chance. Hence, GSEA tells you which gene sets are enriched in either of your sample groups. Some representative results that Basepair gives you are shown in Figure 2 (B). There are several statistics reported for each gene set, but the main ones to pay attention to are NOM p-val and FDR q-val. The latter is less likely to give you a false positive result and should be prioritized. Common thresholds used for FDR q-val are 0.01, 0.05, 0.1, or even 0.25.
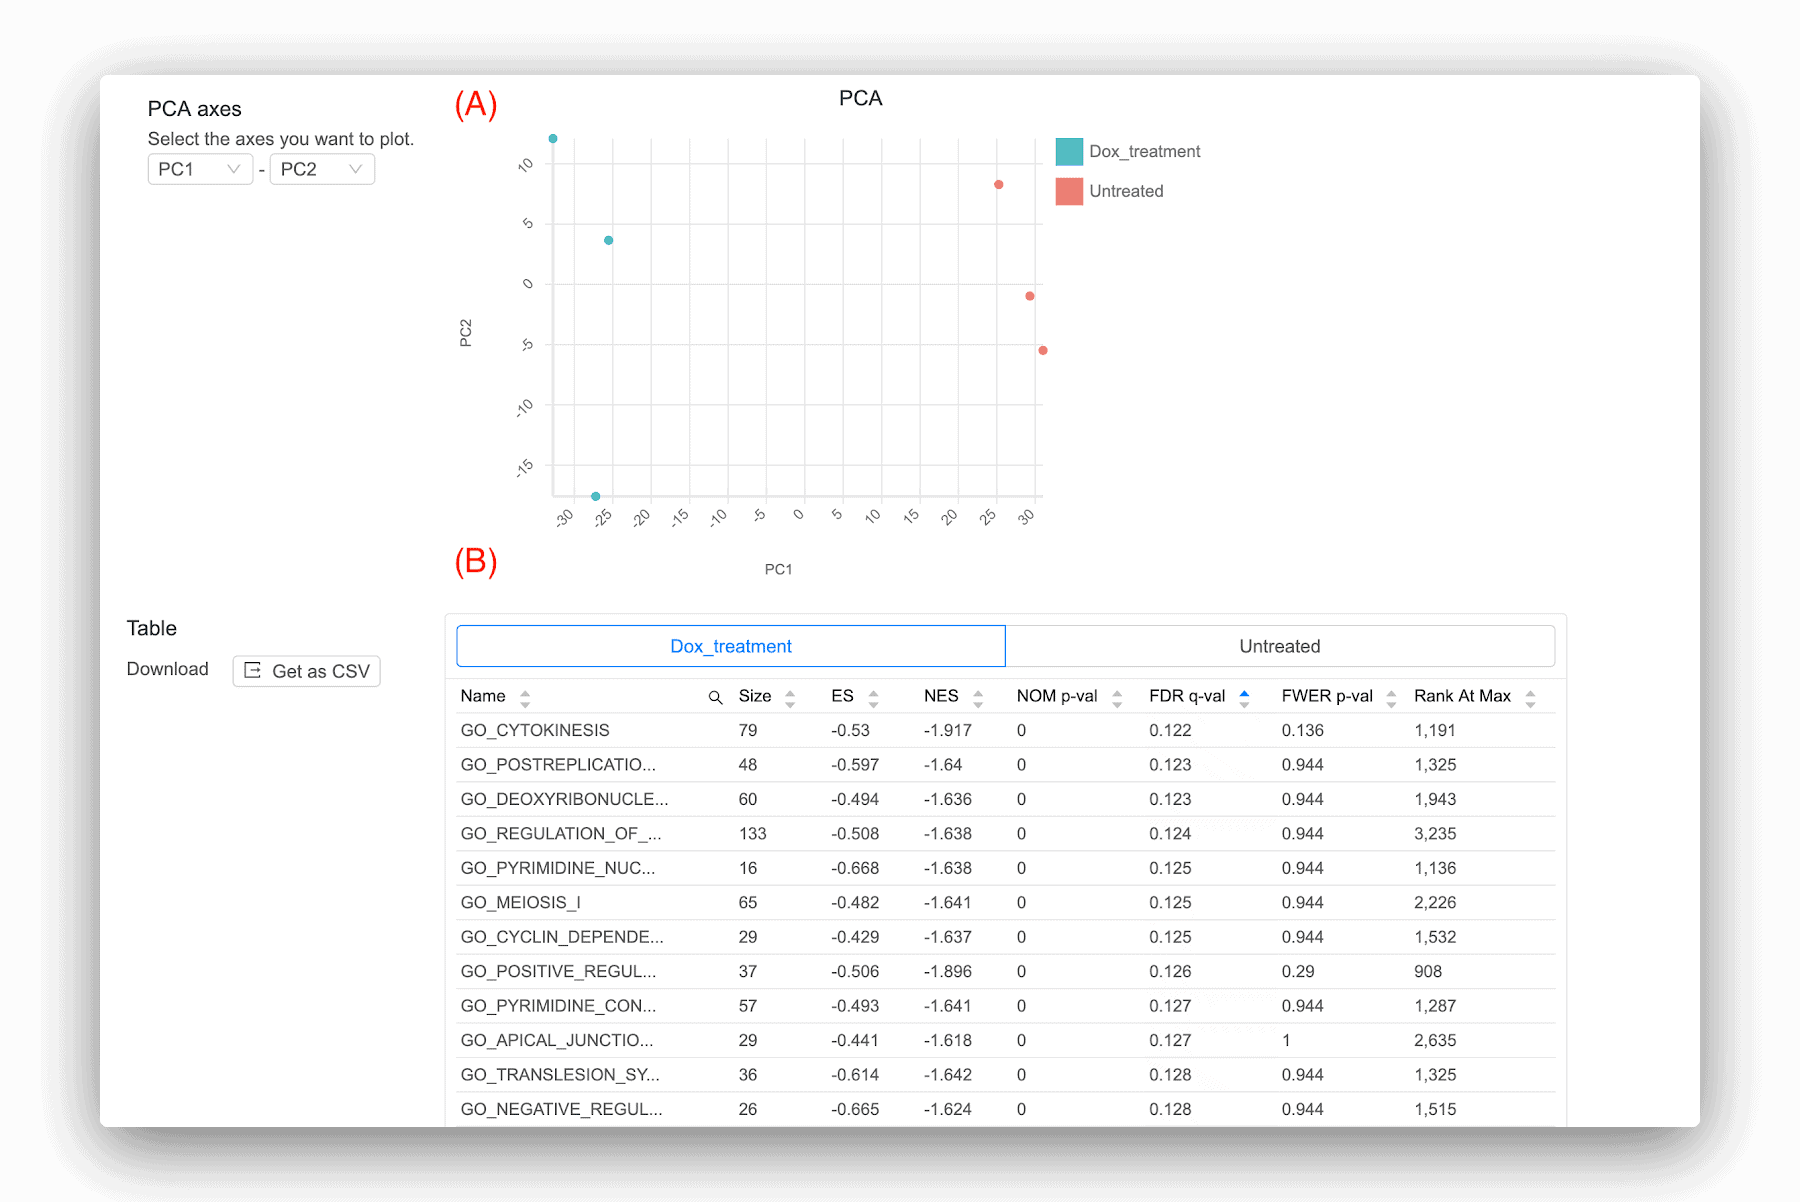
Figure 2: Representative results provided by Basepair. (A) PCA plot, which is a dimensionality reduction technique to show how the samples group together. (B) Pathway analysis using GSEA software.
References
1. Love MI, Huber W, Anders S. Moderated estimation of fold change and dispersion for RNA-seq data with DESeq2. Genome Biol. BioMed Central Ltd; 2014; 15(12):550.
2. A comparison of methods for differential expression analysis of RNA-seq data. BMC Bioinformatics; 2013 Mar 9; 14(1):1-1.
3. Subramanian A, Tamayo P, Mootha VK, Mukherjee S, Ebert BL, Gillette MA, et al. Gene set enrichment analysis: a knowledge-based approach for interpreting genome-wide expression profiles. Proc Natl Acad Sci USA. 2005 Oct 25; 102(43):15545–50.