About us
RNA-Seq refers to the use of next generation sequencing technology (NGS) to estimate RNA population. It is most frequently done by sequencing of mRNA converted to cDNA. Unlike microarrays, RNA-Seq is unbiased (doesn’t need gene annotations in advance) and sensitive (detects low frequency transcripts) method for estimating abundance of transcripts. Additionally, RNA-Seq can be used for finding novel transcripts, fusion events and even genetic variants.
Expression count
The most common use of RNA-Seq is to detect differential gene expression. The analysis process first requires measurement of expression count in each sample, followed by normalization and statistical tests for significant changes.

QC
Before starting the analysis, it is important to know if the raw data is good quality. The primary metric to check this is the quality score. [The quality score is created as part of the sequencing process and is included in the Fastq file.] Next important step is to check for overrepresented sequences. These arise due to contamination of sample, dimerization of sequencing adapters. Further, you can check for distribution of the 4 bases, % GC, etc.
Alignment (aka mapping)
In this step we take each read and find the matching region in the reference genome. This is the most computationally intensive step because the matching needs to permit mismatches, indels, etc., between the read and the reference. The alignment output is stored in bam file format, which contains read name, sequence, quality score, position of alignment and other meta data.
Post-alignment metrics
Since we know that the sequence data is derived from mRNA, this information can be used to access the quality of the data. We measure the percentage of reads aligning to exons, introns and intergenic regions. Greater than 70% alignment to exons is considered good.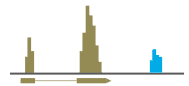
Expression count
The (digital) expression count is the number of reads aligning to the exons of a gene. The count could be done at two levels, either for each transcript or for each gene. Both approach have their pros and cons. For genes with multiple isoforms, using transcript counts lets you identify the specific isoforms that are expressed. However, since the number of transcripts is greater than number of genes, using the former leads to a higher multiple hypothesis correction for differential expression test.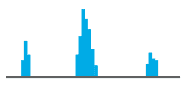
Genomic coverage
Apart from the expression count of each gene, it is useful to be able to see the raw data at loci of interest. The aligned reads are converted to genome coverage, which is the number of reads at each position in the genome. The most common formats for genomic coverage supported by most genome browsers are wig and bigWig. The bigWig files no longer contain individual reads and are much smaller than the bam files.Differential expression
Having determined the expression count of genes for each sample, we combine all the samples in one file, normalize the samples (to correct for library size and other variations) and run statistical test between two or more group to find the differentially expressed genes and other results.

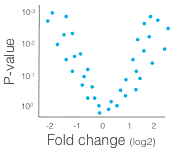
Up and down regulated genes
After running the differential expression test, you may create lists of up and down regulated genes. The least stringent threshold is a (multiple hypothesis corrected) P-value lower than 0.05. Additionally, genes may be filtered if the fold change is less than a threshold. For most downstream analysis, it is good to have a list of 200-1000 genes.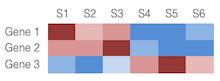
Heatmap
The heatmap is a visual representation of showing the changes in gene expression across the samples. The values in the rows are usually normalized, the color red used to show genes with higher expression and blue for lower expression.