Determining Filtering Thresholds For Single Cell RNA-Seq Data
Amit U Sinha, Ph.D
Last Updated: November 5, 2020
How do you determine the threshold for what cells to keep for downstream single cell RNA-seq analysis? This guide walks you through the process of setting a filtering threshold on Basepair.
Understanding the UMI-per-cell plot
First, let’s take a look at an example UMI-per-cell plot.
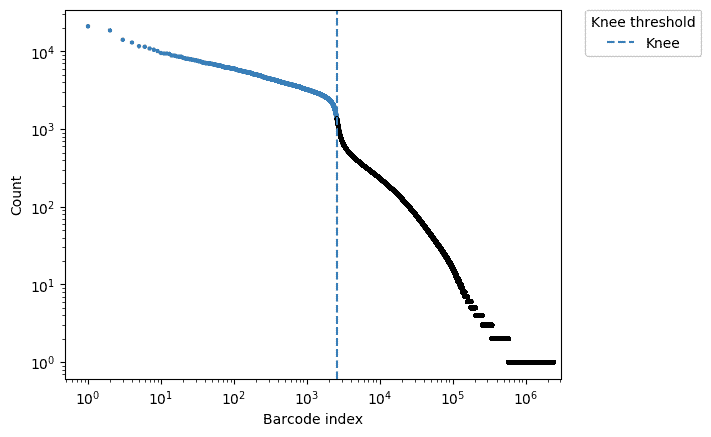
The x axis shows the different barcode sequences. Each point corresponds to a different cell. The y axis corresponds to the total transcriptional content within the cell — in other words, how many reads came from a particular cell. Up on the left are cells with a high amount of reads mapping from the cell. On the lower right are cells with far fewer reads.
Basepair uses Alevin to automatically determine the filtering threshold using the knee method. The blue dotted line represents the filtering threshold itself. Cells in blue are kept, while the cells in black are removed.
Why should we exclude cells with low total RNA?
Let’s take a step back for a moment and consider why we should exclude certain cells from analysis. There can be a number of reasons. Remember that single cell RNA-seq uses an approach called droplet sequencing, and this method can produce certain common errors. For example:
- Droplets may not contain any cells
- Droplets may contain ambient RNA
- Cell barcodes developed sequencing errors
For these reasons, it is important to exclude certain cells.
When should you change default filtering parameters?
We’ve found that on occasion — and we do want to stress that this does not happen frequently — the algorithm doesn’t provide the best default filtering threshold, and the blue line may be too far to the left or right. In other words, the algorithm may set a filtering threshold that is too stringent or not stringent enough.
Let’s take a look at an example of a bad filtering threshold.
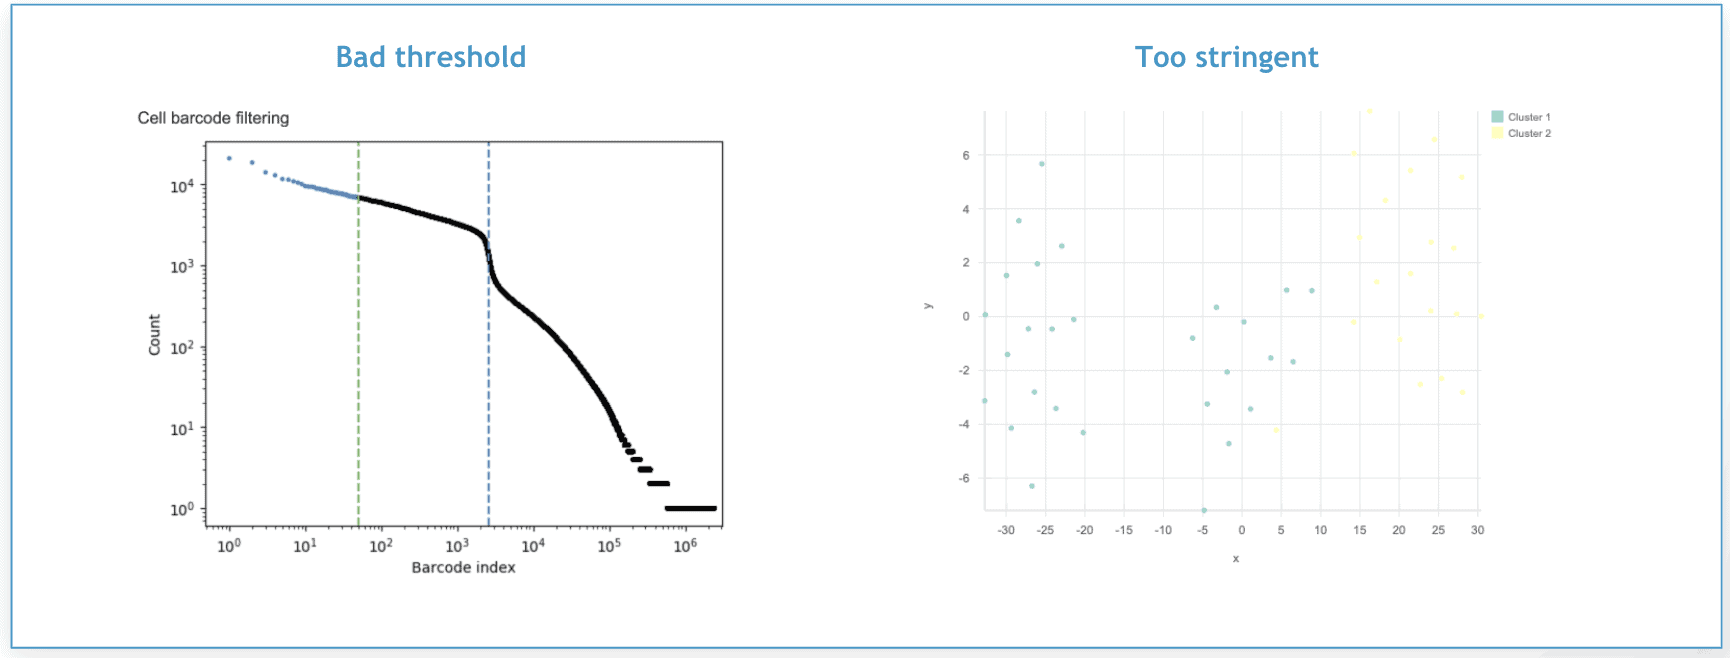
In the figure on the left, the green dotted line represents an overly stringent filtering threshold set to 50 cells. The figure on the right shows the t-SNE plot that was generated from the cells that remained after this filtering threshold was applied. Each point represents a different cell. As you can see, there are just two clusters, which is not particularly useful.
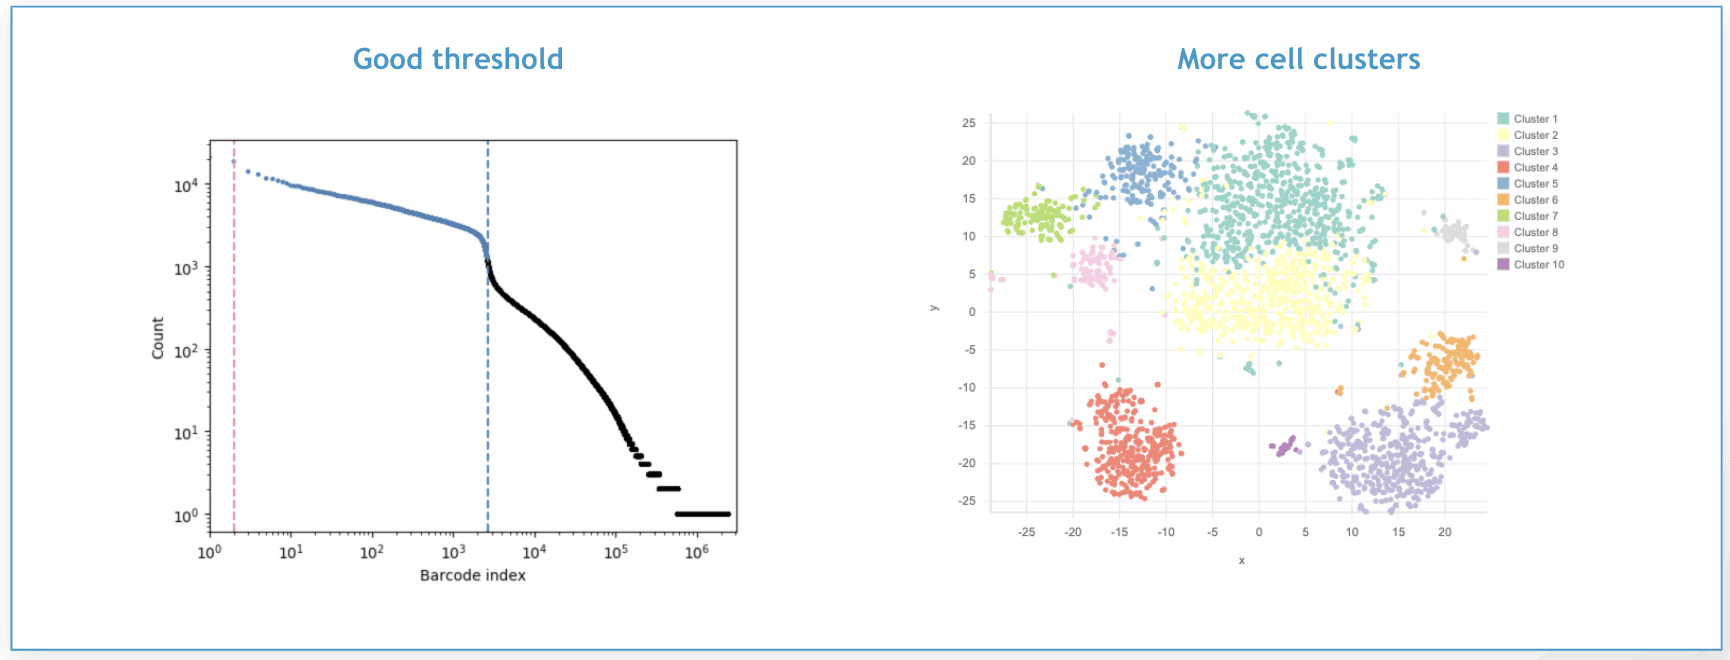
However, if we go back and set a more reasonable filtering threshold, in this case of X cells, we get a t-SNE plot with a larger number of cell clusters, each corresponding to a different cell type or tissue, as you can see below.
How to manually set a filtering threshold
If you want to adjust the filtering threshold, you can do this in two ways:
- By setting an expected cell number
- By specifying the exact number of cell barcodes you want to capture in the analysis.
You can find and adjust these parameters under the “change default options” dropdown menu that appears when you’re setting up a new single cell RNA-seq analysis.
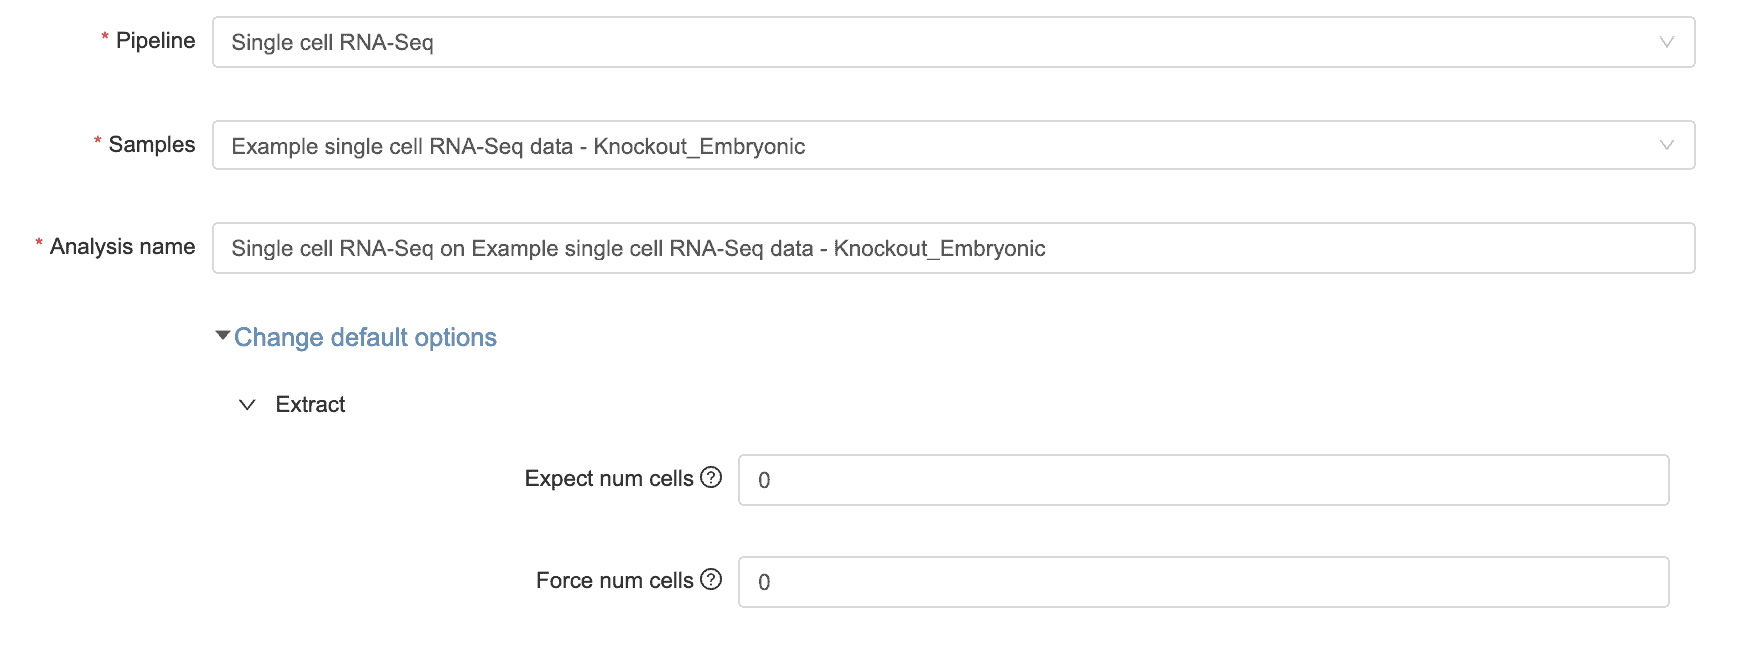
Use the expected cell number to set an upper limit on how many cells are in the sample. Alevin will still determine the threshold on its own but will not exceed the upper limit. To access this parameter when changing default options, click on Extract, then click on “expect cell num.”
Use the set cell number to specify the exact number of cells you want in the sample. This option is useful if your sequencing protocol allows you to have very precise control over how many cells you sequence. To access this parameter when changing default options, click on Extract, then click on “force num cells.”
Iterate and compare
Filtering thresholds really do matter in your analysis. As noted above, in most cases Alevin does a good job of setting an appropriate threshold, but it is always wise to check the threshold.
Remember, Basepair doesn’t charge you extra if you run additional analyses while fine-tuning filtering thresholds. So feel free to run as many analyses as you’d like and compare the outputs. And if you don’t already have a Basepair account, create one here and start analyzing your data right away. Your first 6 samples are free.