
ChIP-Seq Analysis Tutorial
Amit U Sinha, Ph.D
A brief introduction to ChIP-Seq
Protein-DNA interactions are widely used to elucidate the mechanisms underlying cell physiology. Development of the chromatin immunoprecipitation (ChIP) assay technology enabled the study of such mechanisms. Following further development, a deep sequencing alternative (ChiP-Seq) arose, which offers advantages in terms of specificity and sensitivity.
A ChIP-Seq experiment begins with a whole cell cross-link with formaldehyde, followed by sonication and DNA isolation. After that, the immunoprecipitation of the DNA-protein complex is performed, which consists of antibodies binding to specific proteins. The immuno-complexes formed are precipitated and purified. Finally, DNA is sequenced, generating high-resolution data of enriched sites. This approach, together with a well-established ChIP-seq pipeline, allows researchers to capture DNA transcription factors, histone modification sites, epigenetic alterations, and gene regulatory network signatures.
Clinical Relevance and Applications
Epigenetic imbalances across disease and health conditions can involve histone modification and altered transcription factors. Herein, ChIP-Seq studies have been used to elucidate pathologic molecular mechanisms underlying cancer and other diseases. ChIP-seq analysis also contributes to the understanding of the role of transcription factors during diseases. In fact, some transcripts seems to be altered during clinical phenotype manifestations.
Overview of the ChIP-Seq pipeline
The ChIP-Seq analysis pipeline is the main component of DNA-protein interaction projects and consists of several steps, including raw data processing, quality control analysis, alignment to the reference genome, quality check of the aligned reads, peak calling, annotation, and visualization. However, having a thought-out experimental design is crucial to obtaining high-quality results in a ChIP-seq experiment. Before beginning your analysis, it is essential to consider parameters such as sample replicates, control groups, sequencing kits and sequencing platforms.
 Quality Control
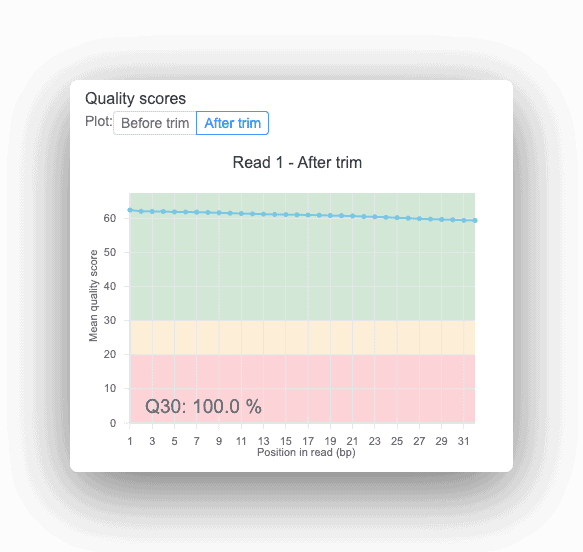
All Basepair reports provide quality scores to help uncover potential sequencing issues or contamination in your input data.
The Quality Control (QC) step aims to evaluate the quality of high throughput data generated from sequencing. This step is similar to those performed in DNA-seq and RNA-seq analyses. Here, the main metrics evaluated include sequence and base quality, GC content, presence of sequencing adaptors and overrepresented sequences. One of the most commonly used programs for this type of analysis is FastQC. Moreover, if low-quality sequences are identified, they can be later removed during the trimming step. Though it is an optional step, trimming improves data quality by retaining only high-quality reads.
Alignment
After QC measurement, ChIP-Seq reads are aligned to a reference genome. Read mapping allows researchers to identify the origin of a read sequence in the genome. Popular alignment software tools used include Bowtie and BWA, both of which are used in Basepair’s ChIP-seq pipelines. Both tools map low-divergent sequences against a reference genome.
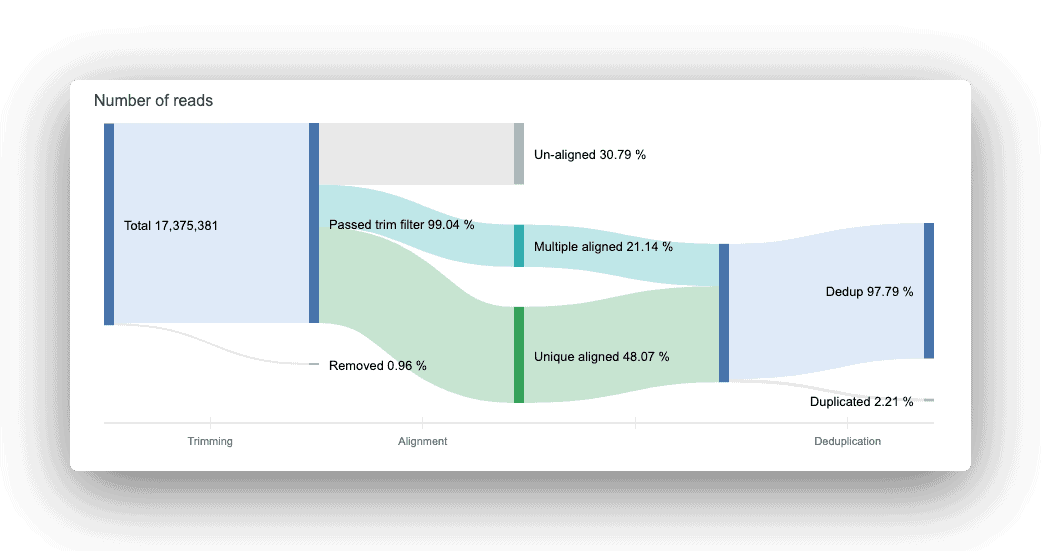
The read count flow helps provide a big-picture overview of usable reads at the end of the trimming, alignment, and deduplication processes. Think of the figure as a data analysis assembly line: input raw data, get an output of usable reads.
Quality check of the aligned reads
The next step consists of QC inference of the aligned dataset. During the mapping process, read duplicates introduced by PCR amplification and sequencing cause biases during peak calling and enrichment analysis. Basepair uses the Picard tool to remove duplicates. Once duplicates have been removed, you should evaluate the Non-Redundant Fraction (NRF) of the aligned reads. NRF measures the unique reads mapping to the reference genome. Ideal ChIP-seq experiments should have less than three reads per position.
Peak Calling
The peak calling step detects enriched protein-DNA interaction regions on the genome. Basepair’s ChIP-seq pipeline uses MACS2 to perform this analysis. In MACS2, peak calling is performed based on three main steps: fragment estimation, followed by identification of local noise parameters and then peak identification. As the output of this step, users obtain a final table with peak information, such as enrichment score, -log10pvalue, -log10qvalue and the position to peak start. The use of control samples are highly recommended in this step for comparison with the target dataset investigated. Keep in mind that good control groups bring about more reliable results.
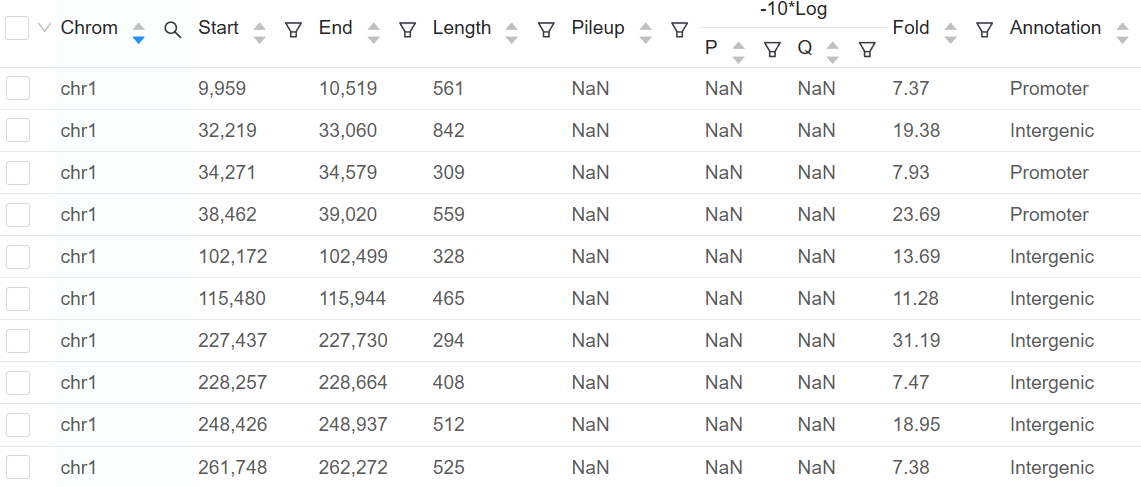
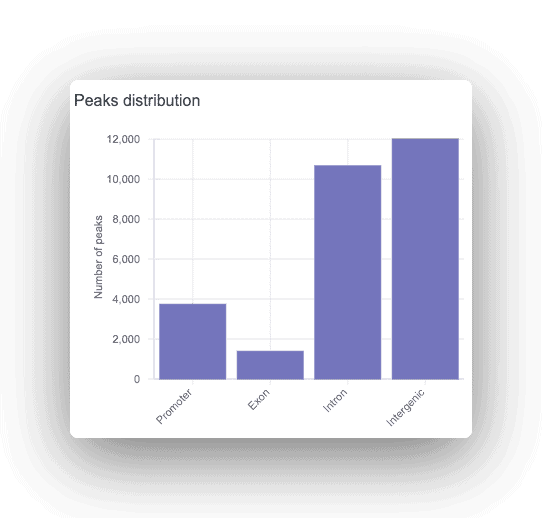
Each peak is annotated as promoter, intronic, or intergenic, with the corresponding gene displayed. For any peaks found, a motif analysis is done to find overrepresented transcription factor binding sites.
Overview of Results
A ChIP-seq pipeline can provide not only information about the chromatin state but also transcription factor binding in a determined gene or loci context. The occurrence of histone modifications and transcription factors in DNA regulatory regions may constitute a condition-specific epigenetic signature. Thus, epigenetic perturbations can be associated with clinical phenotypes. For example, heterogeneity of chromatin states can lead to treatment resistance in breast cancer. These cells tend to lose repressive histone modifications markers and further increase the expression of genes known to promote resistance to cancer treatment.
Peak, Motif and Pathway Analysis in ChIP-Seq Analysis Pipeline
The identification of motif transcription factor enrichment is used to elucidate whether transcription factors are cooperating or competing in a given region. The identification of peaks in DNA motif regions can improve the interpretation of the experimental results. Together, both peak and motif analyses give insight into what may be occurring within a cell. The integration of peak and motif enrichments result in an epigenomic landscape with possible biological consequences. Furthermore, pathway analysis is used to identify proteins in a pathway. Investigations and conclusions are formulated based on a protein presence.
Data Visualization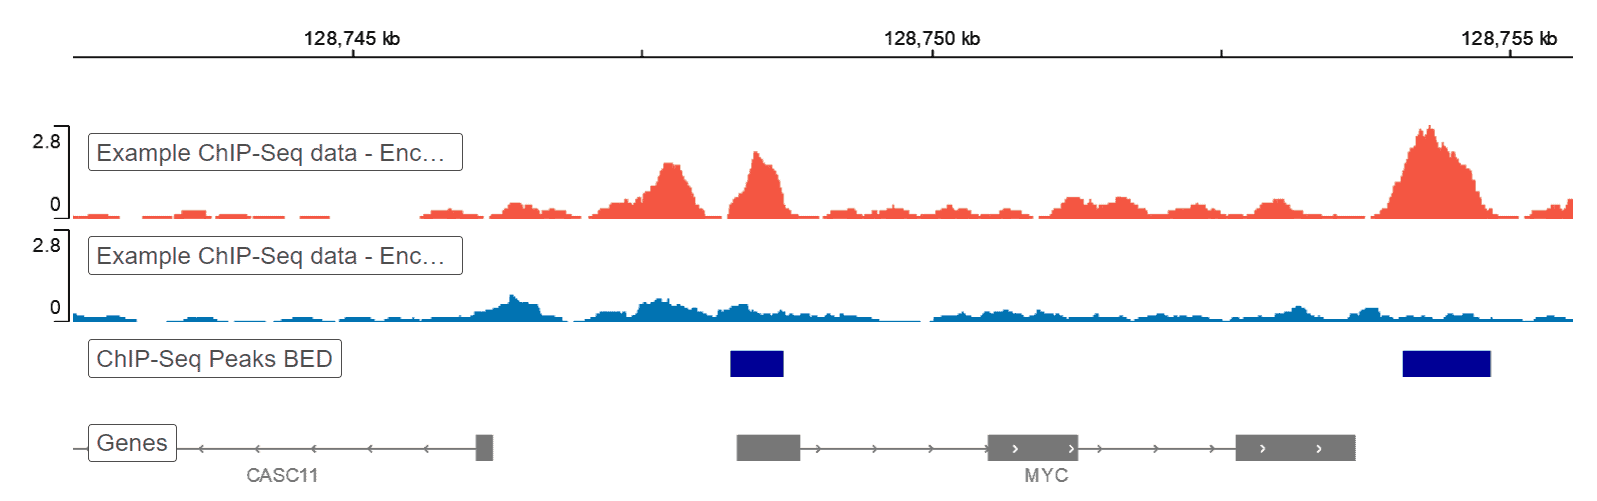
Resulting data from a ChIP-seq pipeline can be visualized using a genome browser. Basepair reports include an embedded IGV2 genome browser that allows you to interact with you data. Data can alternatively be visualized using heatmaps, which are representative intensity infographics based on data density that show the presence or absence of specific marks. Other graphics used here include enrichment plot, upSet and coverage plot, which both calculates and displays the coverage of peak regions over the genome.
The genome browser is a great tool for visualizing your raw genomic data. It’s built into every ChIP-seq analysis report on Basepair.References
1. Grosselin, K., A. Durand, et al. High-throughput single-cell ChIP-seq identifies heterogeneity of chromatin states in breast cancer. Nat Genet, v.51, n.6, Jun, p.1060-1066. 2019.
2. Northrup, D. L. e K. Zhao. Application of ChIP-Seq and related techniques to the study of immune function. Immunity, v.34, n.6, Jun 24, p.830-42. 2011.
3. Park, S. J., J. H. Kim, et al. A ChIP-Seq Data Analysis Pipeline Based on Bioconductor Packages. Genomics Inform, v.15, n.1, Mar, p.11-18. 2017.
4. Pepke, S., B. Wold, et al. Computation for ChIP-seq and RNA-seq studies. Nat Methods, v.6, n.11 Suppl, Nov, p.S22-32. 2009.
5. Satoh, J., N. Kawana, et al. Pathway Analysis of ChIP-Seq-Based NRF1 Target Genes Suggests a Logical Hypothesis of their Involvement in the Pathogenesis of Neurodegenerative Diseases. Gene Regul Syst Bio, v.7, p.139-52. 2013.