
What is ATAC sequencing?
ATAC-Seq is Assay for Transposase-Accessible Chromatin sequencing. It is used for genome-wide identification of chromatin accessibility. The assay uses hyperactive Tn5 transposase, which both cuts and ligates adapters at accessible regions of chromatin. Sequencing reads can then be used to determine regions of accessible chromatin and map regions of transcription factor binding and nucleosome position. Unlike other assays that need millions of cells, ATAC-Seq has a simple protocol that works well with 50,000 cells.
For a more detailed introduction to ATAC-Seq why not check out our overview of pipelines.
Fast, automated ATAC-Seq analysis
Data-specific reports
Each of our 30+ pipelines generates reports built from the ground up for your specified data type.
Start analyzing now
Running ATAC-Seq pipelines is as simple as uploading a .fastq file and clicking a button.
Speedy results
Sample analysis usually takes under an hour to finish, thanks to cloud-native, ultra-fast servers.
Reports tailored to your ATAC-Seq data
Basepair’s ATAC-Seq piplines include comprehensive options such as alignment, QC, read counts, gene body and transcriprtion start site heatmaps, open chromatin region identification, and annotation. After you run your analysis, all plots and figures are generated automatically, giving you publication-ready results instantly!
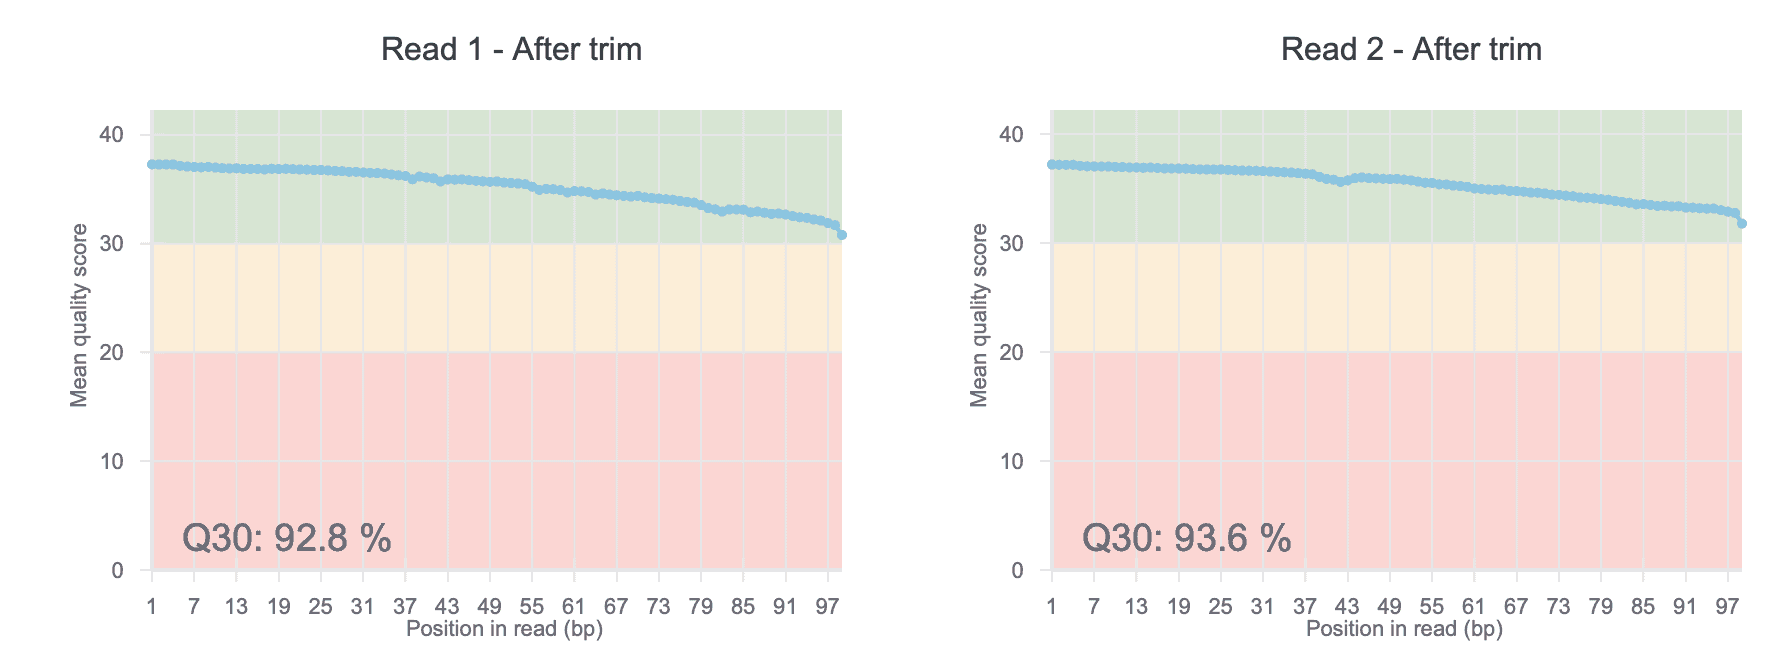
QC Plots
Inspect the quality of your raw ATAC-Seq data with our before- and after-trim QC charts. The QC score allows you to easily uncover sequencing issues or contaminations in your dataset.
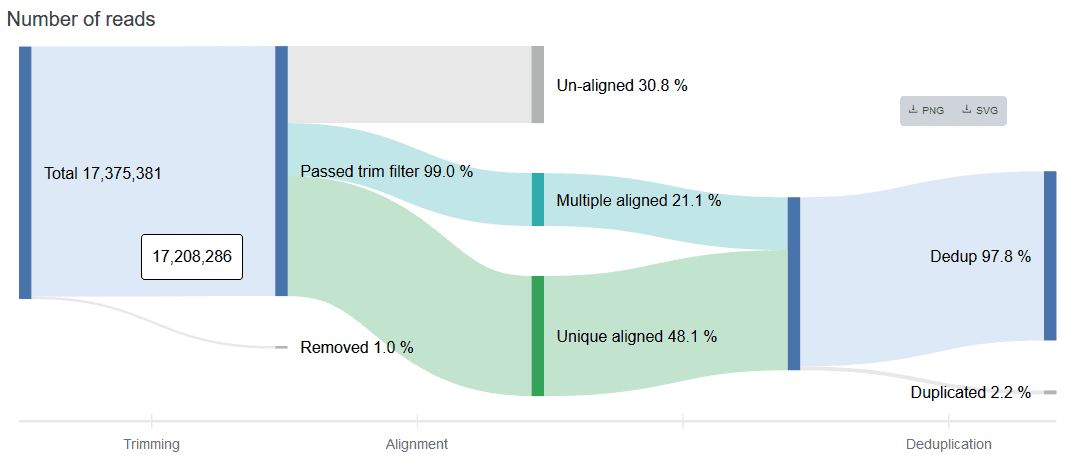
Read Count Flow
The read count flow helps provide a big-picture overview of usable reads at the end of the trimming, alignment, and deduplication processes. Think of the figure as a data analysis assembly line: input raw data, get an output of usable reads.
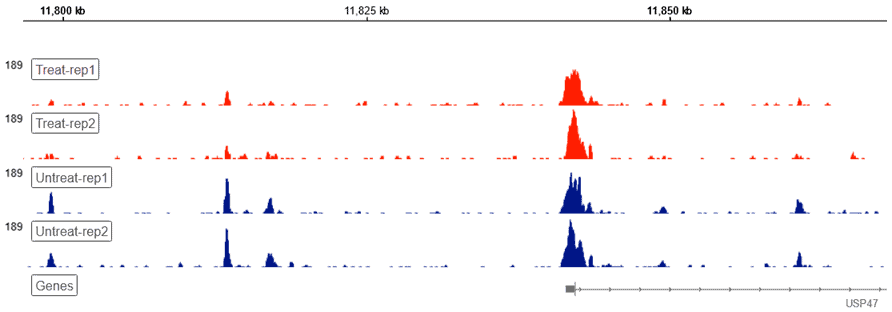
Genome Browser
Basepair’s built-in Genome Browser allows for a bird’s-eye view of you raw genomic data. Our platform handles any conversions under the hood, presenting you with a visual overview of your ATAC-seq data without additional file conversions or software necessary.
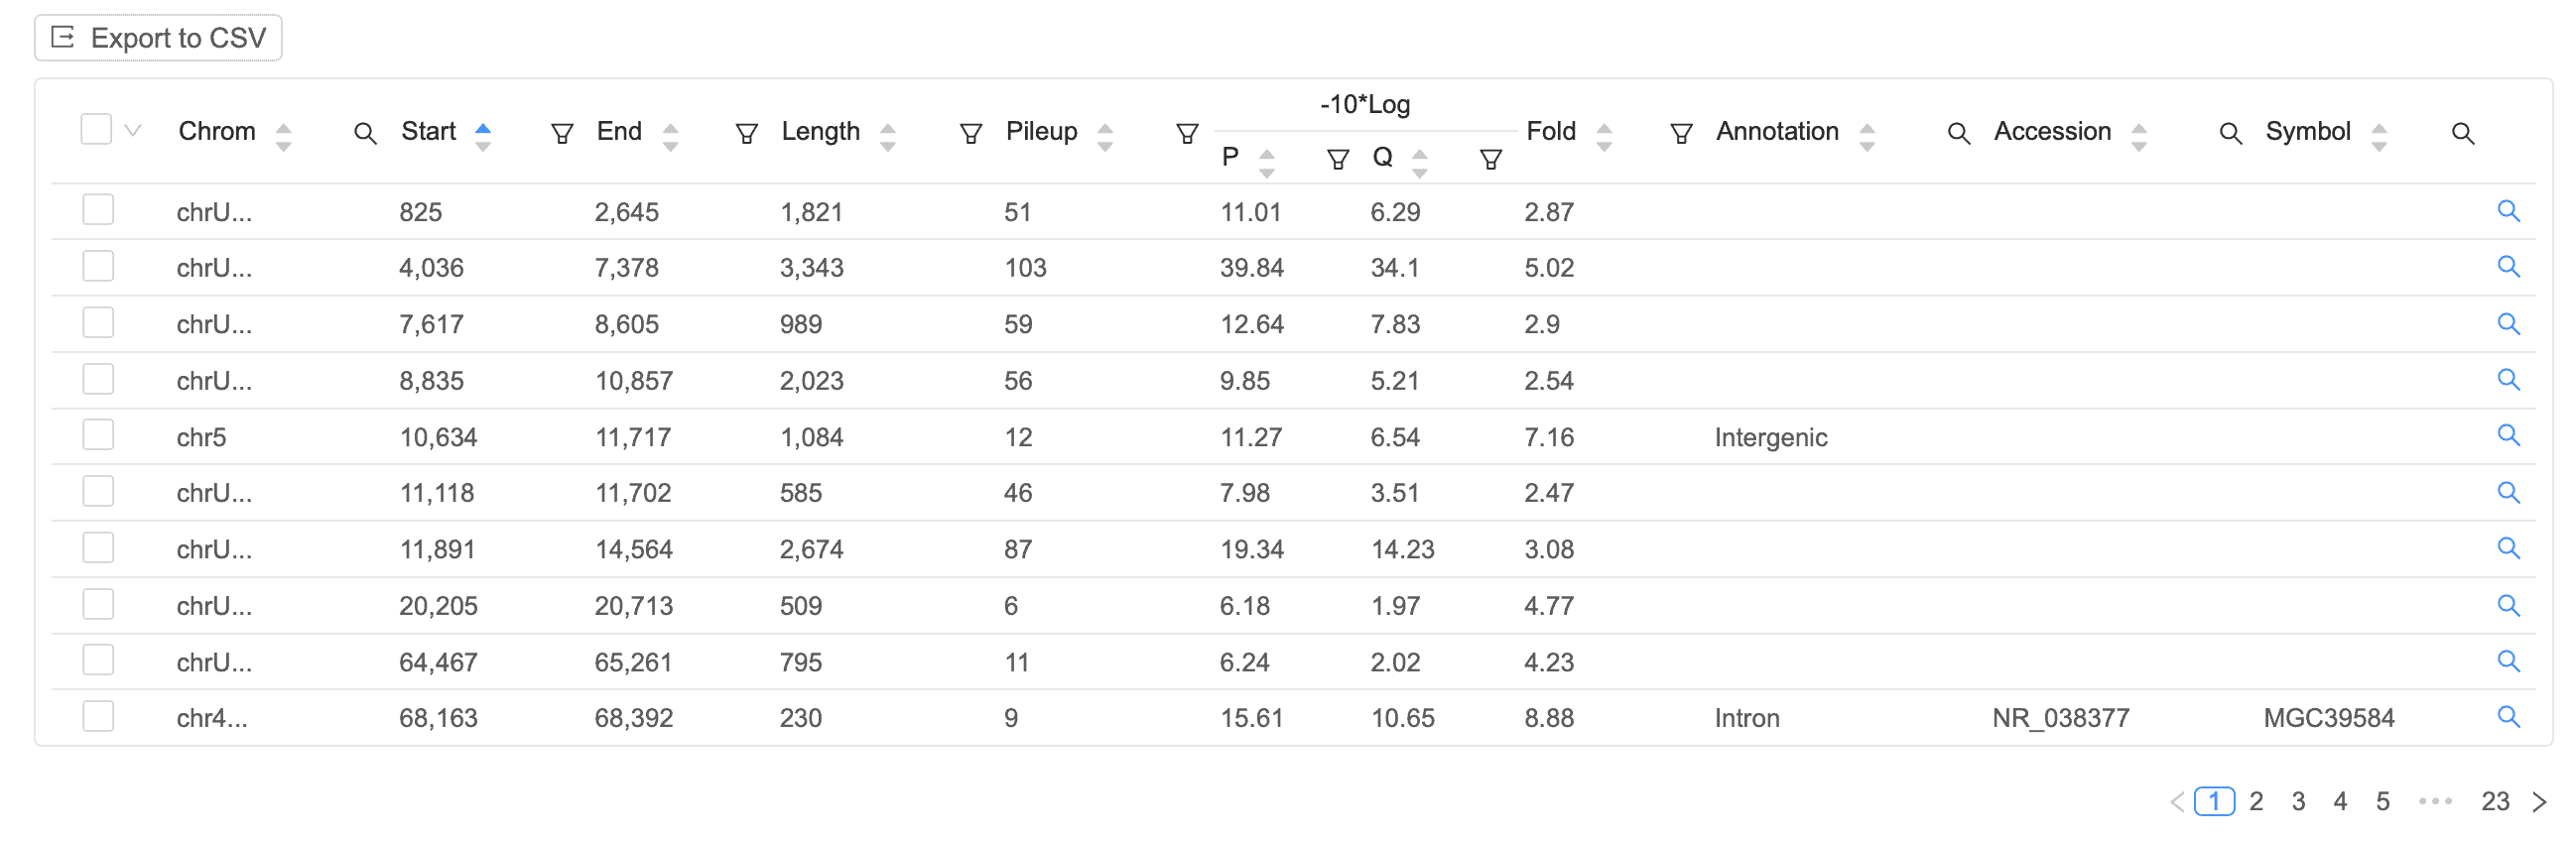
Peak Table
Easily identify signal peaks in your data. Each peak is annotated as promoter, intronic, or intergenic, with the corresponding gene displayed on the table.
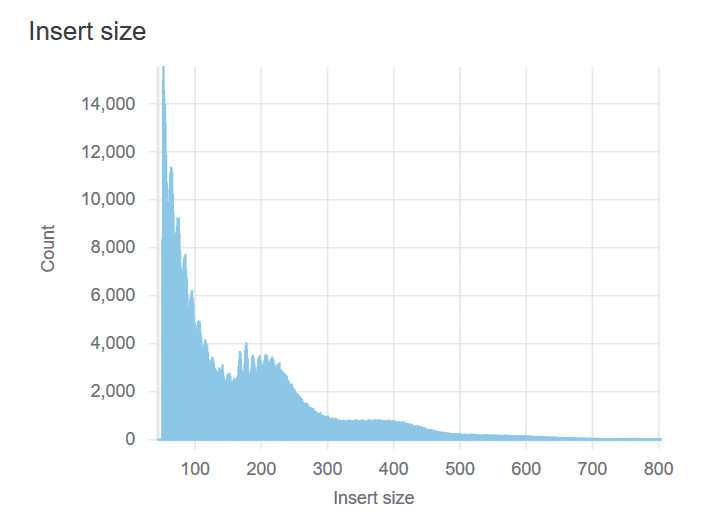
Insert Size Plot
Besides measuring nucleosome-free DNA, ATAC-seq also captures the local chromatin structure. The insert size distribution typically demonstrates enrichment of mono- and di-nucleosome fragments at 200bp and 400bp. A successful library should have a mixture of both subnucleosomal (<100bp) and nucleosomal-sized fragments.
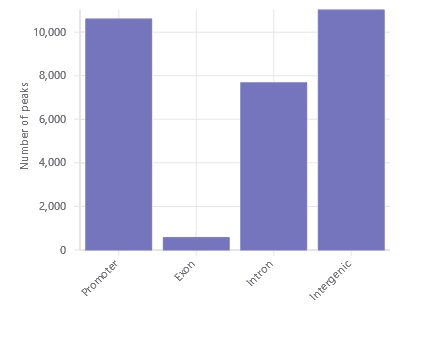
Peak Distribution
Find the distribution of promoter, gene body, and intergenic peaks at a glance with the peak distribution plot.
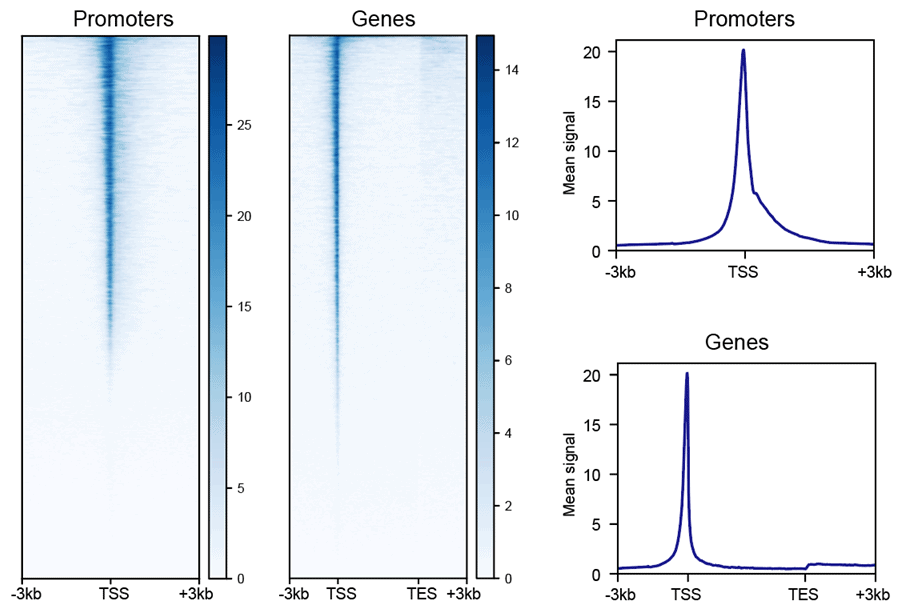
Heatmap & Profile for Gene Body and Transcription Start Site
The heatmap and composite profiles summarize your data around transcription start sites (TSSs) and annotated genes. This allows you to visually asses the quality of your ATAC-seq data by comparing highly accessible gene promoters to signal in the surrounding regions.
Set up your ATAC-Seq analysis in minutes
Try our free 14-day trial now. Explore our sample reports or upload your own ATAC-Seq data. See why the world’s top institutions are using Basepair to save thousands of hours (and dollars) on their NGS data analysis projects.
Basepair Work is in Dozens of Peer-Reviewed Journals
"Fast, excellent and reasonably priced...you CAN get all three!! Thank you to the folks at Basepair for helping us deal with some difficult RNA Seq data."
"I really like how easy the website is to use. And how quickly the results are generated, including figures. I would have never thought about doing a new analysis like I just did."
"Support answers come fast and are always precise!"